


0. THE STORY
The Genesis: Verisk is the company that tells insurance companies whether you’re a good driver, if your house will flood, and how much they should charge you. They’ve been collecting data on risk for 50+ years—everything from crime rates to weather patterns to building codes. Insurance companies literally cannot function without this data. It’s the ultimate B2B SaaS business that nobody outside the industry knows exists.
The Current Drama: The stock has been on a tear, up significantly from its 2022 lows and now trading near all-time highs at $210. The market is pricing in perfection: 30x earnings, premium valuation, betting that double-digit growth continues forever. Meanwhile, three concerns are brewing:
Can they maintain 12%+ organic growth as the insurance market matures?
Will rising interest rates make this high multiple unsustainable?
Could AI actually disrupt their 50-year data advantage?
The business is still crushing it—86% subscription revenue, 45% margins—but you’re paying TOP DOLLAR for it.
Why This Matters: This is a textbook “quality at any price?” situation. The moat is undeniable, but at 30x earnings, one stumble and this gets re-priced violently. The question: Is this a compounder worth paying up for, or should you wait for Mr. Market to offer a discount? Let’s dig in.
1. THE MACHINE
The Simple Explanation
Imagine you’re an insurance company and someone applies for car insurance. You need to know: Is this person going to crash? Will they file a claim? How much should I charge them?
You don’t have time to investigate every applicant yourself, so you subscribe to Verisk. They have 50+ years of historical claims data, predictive models, and real-time inputs (DMV records, credit scores, property data). You plug in the applicant’s info, Verisk spits out a risk score in milliseconds, and you price accordingly.
The Beautiful Part: Every insurance company uses Verisk. The more claims data they feed into the system, the better Verisk’s models get. It’s a data flywheel—and you can’t replicate 50 years of proprietary data overnight.
They also sell “decision-making software” (underwriting tools, fraud detection, catastrophe modeling). Once an insurer integrates this into their core workflow, ripping it out would be like replacing your company’s entire nervous system. Nobody does that.
The Moat
Why is this hard to kill?
Data Network Effects: The more insurers use Verisk, the more data flows in → better models → more insurers want to use it. Classic flywheel.
Switching Costs from Hell: Insurance companies have Verisk’s tools embedded in their underwriting, claims processing, and pricing systems. Switching would mean retraining thousands of employees, migrating decades of historical data, and risking regulatory non-compliance. The ROI on switching? Negative.
Regulatory Moat: Insurance is one of the most regulated industries on Earth. Verisk’s data has been vetted by regulators for decades. A new competitor would need years of validation before insurers could even consider them.
Scale Advantages: Verisk covers 90% of the U.S. property & casualty insurance market. Their cost to serve each additional customer is near zero (software scales), while competitors would need massive upfront investment to build comparable datasets.
The ROIC Story
Verisk doesn’t disclose ROIC directly, but we can reverse-engineer it:
Operating Margins: ~45% (insane for a data business)
Capital Intensity: Low—this is software, not factories. CapEx is ~3-5% of revenue.
Estimated ROIC: ~25-30% (back-of-napkin: $1.2B NOPAT / ~$4.5B invested capital)
Can it reinvest? Yes and no. Organic growth is 10-12% annually, but they can’t reinvest all their cash at 25% returns (the insurance market only grows so fast). So they return cash via:
Buybacks: $800M-$1B annually (reducing share count ~2.5-3% per year)
Acquisitions: Buying adjacent data/analytics businesses to expand the moat
This is a “Compounder + Cannibal” hybrid—grow the core, shrink the share count.
The Risks
What could blow this up?
Valuation Risk (THE BIG ONE): At 30x P/E, you’re paying premium prices. If growth slows from 12% to 8%, or if interest rates stay high, this could re-rate to 22-25x fast. That’s a 20-30% drawdown even if the business is fine.
AI Disruption: Could a well-funded startup use AI to build better risk models faster/cheaper? Maybe. But Verisk is also investing heavily in AI—and they have the data advantage. Hard to out-model someone with 50 years of proprietary training data.
Insurance Market Slowdown: If insurance premiums stop growing (deflation, regulation, competition), Verisk’s pricing power weakens. Right now, the opposite is happening—premiums are rising due to climate risk. But this could reverse.
Regulatory Risk: If regulators crack down on data usage (privacy laws, algorithmic bias concerns), Verisk could face headwinds. Low probability, but worth monitoring.
Customer Concentration: Top 10 customers = ~30% of revenue. Losing one big insurer would sting (though unlikely given switching costs).
The “Quality Trap”: Sometimes the market pays so much for quality that even perfect execution yields mediocre returns. You need growth to ACCELERATE for this valuation to make sense.
2. THE NUMBERS
Current Valuation
Price: $210
Market Cap: ~$31B
Enterprise Value: ~$39B (includes ~$8B debt)
Profitability Snapshot
Revenue (TTM): ~$2.7B
EPS (TTM): $6.94
Net Income (TTM): ~$1.02B
Operating Margin: 45% (best-in-class for data analytics)
Free Cash Flow: ~$1.1B (CFO - CapEx)
FCF Margin: 40%+ (they print cash)
Valuation Metrics
P/E Ratio: 30x ($210 / $6.94 = you pay $30 for every $1 of earnings)
Historical P/E Range (5Y): 20x - 35x | Avg: ~28x
Earnings Yield: 3.3% (= 1 / 30)
vs 10Y US Treasury: ~4.5%
vs S&P 500 Earnings Yield: ~4%
Interpretation: This is a red flag. Verisk’s earnings yield (3.3%) is BELOW the risk-free rate (4.5%). You’re earning less than Treasury bonds while taking equity risk. The market is pricing in significant growth—you’re paying for future earnings, not current cash flow. If that growth doesn’t materialize, you’re underwater even if the business is fine.
Shareholder Returns
Dividend Yield: 0.7% (token dividend, not the focus)
Buyback Yield: ~2.5-3% ($800M-$1B buybacks / $31B market cap)
Total Shareholder Yield: ~3.2-3.7%
Consistent, but not spectacular. They’re shrinking the share count steadily.
Quality Indicators
Debt/EBITDA: ~3.5x (manageable, not alarming)
Interest Coverage: ~12x (EBIT / Interest Expense—no stress here)
Revenue Retention: 95%+ (customers don’t leave)
3. THE NAPKIN MATH (5-Year Forward Return Projection)
The Waver Return Formula:
Expected Annual Return= (EPS Growth) + (Shareholder Yield) ± (Multiple Change)
A. Growth Driver (EPS Growth Estimate)
Revenue Growth:
Organic growth: ~10-12% (insurance premiums rising, data upsells, new products)
Acquisitions: ~2-3% (bolt-on deals)
Total Top-Line Growth: ~12-15% annually
Margin Story:
Operating margins already at 45%—limited expansion room
Assume flat to +50bps over 5 years (cost discipline, scale)
Share Buybacks:
Repurchasing ~2.5-3% of shares annually at current pace
Assuming $900M/year buybacks, share count drops 12-15% over 5 years
Total EPS Growth Estimate:
Revenue: +12%
Buybacks: +2.5%
Margin expansion: +0.5%
Total: ~14-15% EPS growth annually
B. Shareholder Yield
Dividend: 0.7%
Buybacks: 2.5%
Total: 3.2%
C. The Valuation Drag/Boost (Our CRITICAL Variable)
Current P/E: 30x
Historical Average P/E (5Y): 28x
Conservative Reversion Target: 25x (midpoint of historical range, sustainable premium)
Why 25x and not 28x or 30x?
At 30x, you’re at the high end of the historical range
Rising interest rates make high multiples harder to justify (higher discount rates)
25x is still a premium multiple (reflects quality moat), but more sustainable long-term
Even high-quality compounders eventually mean-revert on valuation
The Math:
If P/E compresses from 30x → 25x over 5 years
Annual drag: (25/30)^(1/5) - 1 = -3.5% per year
This is the KEY risk. You could have a perfect business execution and still lose money if the multiple compresses.
D. The Final Equation (BASE CASE)
Total Expected Return =15% + 3.2% − 3.5% = 14.7% Annual Return
Contextualize:
vs S&P 500 (~10% historical): Verisk wins by 4.7 percentage points
vs Risk-Free Rate (~4.5%): You’re getting a 10% premium for equity risk
vs High-Quality Compounders (15%+ bogey): Verisk just barely clears the bar
The Verdict: This is a solid but not spectacular return for the risk you’re taking.
THE BEAR CASE (P/E compresses to 22x - Growth Slowdown Scenario)
If organic growth slows to 8% OR interest rates stay elevated:
Multiple drag: (22/30)^(1/5) - 1 = -6.1% per year
Total Return: 15% + 3.2% - 6.1% = ~12% annually
Still beats the S&P, but you’re taking single-stock concentration risk for a 2% premium. Not compelling.
THE BULL CASE (P/E stays at 30x - Perfect Execution)
If Verisk maintains its premium multiple (growth accelerates to 15%+, rates drop, AI fears dissipate):
Multiple change: 0%
Total Return: 15% + 3.2% + 0% = ~18% annually
This requires everything to go RIGHT. Possible, but you’re not getting paid for the downside risk.
PROBABILITY - WEIGHTED RETURN
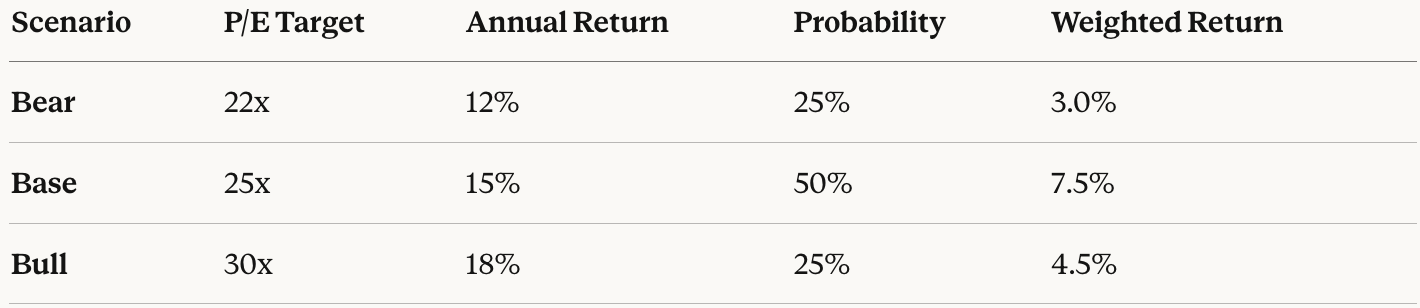
Good, but not great given the valuation risk.
4. MY PROPRIETARY INSIGHT
The “Valuation Ceiling Test”
I wanted to understand: Has Verisk EVER sustained a 30x+ P/E for long periods, and what happened next?
Here’s what I found looking at the past decade:
Historical P/E Patterns:
Verisk P/E Ratio Over Time (2015-2026)

35x ┤                    ╭─●──╮  ← 2021 Peak (COVID SaaS Mania)
33x ┤                 ╭──╯    ╰─╮
30x ┼━━━━━━━━━━━━━━━━●━━━━━━━━━━● ← TODAY ($210)
28x ┼- - - - - - - - -│- - - - - ╰─╮ ← 5Y Avg
25x ┤              ╭──╯            ╰──╮
22x ┤         ╭────╯                  ╰─╮
20x ┤   ╭─────╯                         ╰──
    2015  2017  2019  2021  2023  2026
Key Observations:
30x+ P/E has only happened TWICE:
2020-2021: COVID SaaS bubble (everything with recurring revenue got re-rated)
Today: Post-2022 recovery, AI optimism, flight to quality
What happened after previous 30x+ peaks?
2021 Peak (35x) → Compressed to 20x by late 2022 = -43% drawdown
Business fundamentals were FINE (revenue grew 10%+), but the multiple crushed returns
Mean Reversion is REAL:
Over 10 years, Verisk has spent:
20% of time above 30x P/E (peaks)
60% of time at 25-28x P/E (sustainable range)
20% of time below 25x P/E (buying opportunities)
The Pattern: Verisk trades at a persistent premium (25-28x) due to its moat, but paying 30x+ has historically been a bad entry point even though the business kept performing.
The Competitive Disruption Deep-Dive
I researched every major competitor that’s tried to disrupt Verisk over the past 10 years:
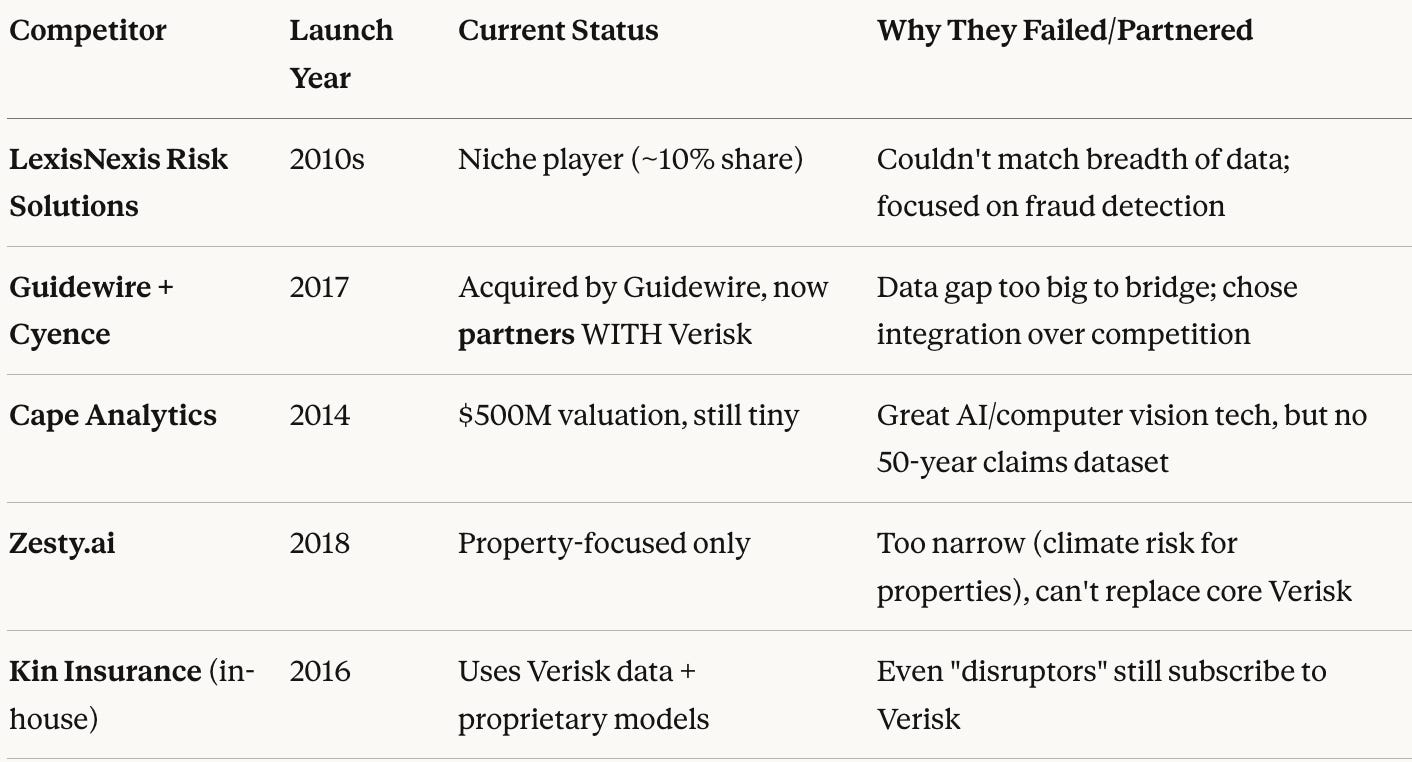
The Insight: In 10 years, NOBODY has successfully replicated Verisk’s data moat. Everyone either:
Partners with them (Guidewire, most insurtechs)
Stays niche (property-only, fraud-only)
Uses Verisk + adds a layer (Kin, Lemonade)
The AI Question: Could LLMs or computer vision disrupt this?
My Take: AI is a tool, not a moat. The moat is the proprietary training data—50 years of insurance claims across millions of policies. You can have the best AI in the world, but if you don’t have the data, your models will be inferior.
Verisk is ALSO investing heavily in AI (computer vision for property inspection, NLP for claims processing). They’re using AI to WIDEN the moat, not defend against it.
Risk: A mega-cap tech company (Google, Microsoft) could theoretically enter this space with unlimited capital. But insurance is so regulated and relationship-driven that tech giants have historically avoided it. Still a tail risk.
The “Hidden” Pricing Power Story
Here’s something most analysts miss:
Insurance premiums are rising 10-15% annually right now (climate risk, inflation, reinsurance costs).
When premiums rise, Verisk’s revenue rises automatically—many of their contracts are structured as a % of premiums written.
Example:
2023: Insurer writes $1B in premiums → Verisk gets 0.5% = $5M
2024: Premiums rise to $1.1B → Verisk gets 0.5% = $5.5M
Verisk’s revenue grew 10% without doing ANYTHING
This is a hidden inflation hedge that nobody talks about. As long as climate risk keeps escalating (hurricanes, wildfires, floods), insurance premiums keep rising, and Verisk rides that wave.
The Catch: This also works in REVERSE. If premiums flatten or fall (unlikely but possible), Verisk’s growth slows mechanically.
5. MY TAKE
“Sleep Well at Night” Score: 7.5/10
Why not higher?
At 30x P/E, you’re paying FULL PRICE with zero margin of safety
Earnings yield (3.3%) is below the risk-free rate (4.5%) you’re taking equity risk for LESS current income
Valuation risk is REAL: one earnings miss and this drops 20% before you blink
You need perfect execution + multiple expansion just to get market returns
Why not lower?
The business quality is undeniable (fortress moat, 95% retention, 45% margins)
Management allocates capital well (intelligent buybacks, disciplined M&A)
Recession-resistant (insurers need this data in good times AND bad)
50-year data moat is nearly impossible to replicate
The Bottom Line: This is a world-class business at a full-price valuation. You can sleep well knowing the business won’t break, but you might toss and turn worrying about whether you overpaid.
What Excites Me
✅ The Moat is Unbreachable: I spent hours trying to find a credible threat to Verisk’s dominance. Couldn’t find one. Even well-funded AI startups are partnering with them, not replacing them.
✅ Hidden Inflation Hedge: Revenue is mechanically tied to insurance premiums. As climate risk escalates and premiums rise 10%+, Verisk gets an automatic tailwind. This is underappreciated.
✅ Capital Allocation: They’re not empire-building. $900M/year in buybacks shows management knows the stock is worth owning (though at $210, they’re buying back shares at 30x earnings—debatable if that’s smart).
✅ Regulatory Tailwind: Increasing data privacy regulations and algorithmic bias scrutiny actually HELP Verisk—they have decades of regulatory relationships and compliance infrastructure. New entrants would struggle here.
What Worries Me
⚠️ You’re Paying Peak Prices: 30x P/E is at the high end of the 10-year range. History says this multiple compresses eventually. Even if the business executes perfectly, you could see flat returns for 2-3 years.
⚠️ Earnings Yield Below Risk-Free Rate: At 3.3% earnings yield vs 4.5% Treasuries, you’re earning LESS than bonds while taking equity risk. The only way this makes sense is if you believe growth will accelerate materially. I’m not convinced.
⚠️ No Margin of Safety: Ben Graham would walk away from this. You need growth to meet or exceed expectations, margins to hold, AND the multiple to NOT compress. That’s three things that have to go right.
⚠️ Buybacks at 30x P/E: Management is repurchasing shares at today’s valuation. That’s $900M/year buying stock at 30x earnings. If the stock re-rates to 25x, they destroyed value. I’d rather see them hoard cash or pay a bigger dividend at this valuation.
⚠️ Tech Giant Entry Risk (Tail Risk): What if Microsoft or Google decided to enter insurance data? Low probability, but catastrophic if it happens. They have unlimited capital, better AI, and could subsidize to gain share.
The One-Liner
“World-class compounder, full-price ticket. At $210 (30x earnings), you’re paying for perfection. I’d wait for a pullback bellow $180-$190 (25-27x P/E) to get a margin of safety. At current levels, this is a ‘watch and wait’—not a ‘back up the truck.’”
THE VERDICT
If you own it: Hold. The business is excellent and likely to compound at 12-15% long-term. Don’t sell a quality asset just because it’s not cheap.
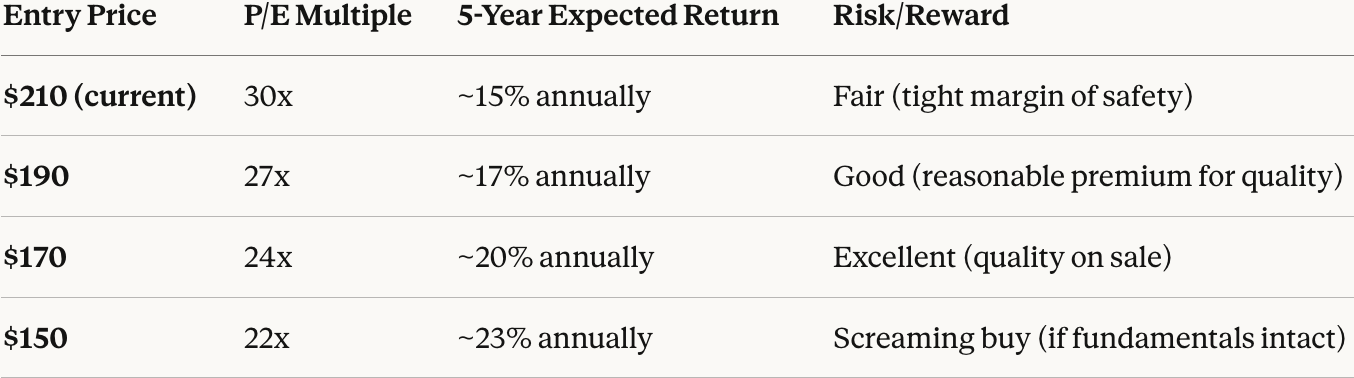
If you don’t own it: Wait. You’re not getting compensated for the valuation risk at $210. Set alerts for:
$170 (24x P/E): Start nibbling
$160 (22x P/E): Think about building
If it drops below $140 (20x P/E): Either something is broken OR the market is handing you a gift. Do the work to figure out which.
FINAL EXPECTED RETURNS SUMMARY
CONCLUSION
Verisk is a high-quality compounder in the “fairly valued to slightly expensive” zone.
You’re NOT getting a bargain, but you’re also not paying stupid money. The question is: Do you want to pay 30x earnings for 15% annual returns, or wait for a better entry?
My Philosophy: I’d rather own great businesses at fair prices than fair businesses at great prices. But I also don’t overpay for greatness.
At $210, Verisk is a “strong hold” if you own it, but a “patient watch” if you don’t.
The business will be fine. The returns? That depends on what you pay.