

The Wisdom of the Crowd: Our Subscribers' Stock Picks
Tapping into the collective wisdom of our subscribers.

Free podcast version available on Spotify, Apple Podcasts or directly here
Let's pull back the curtain and take a peek at three intriguing companies that have caught your eye and may earn a coveted spot on our watchlist. These are the businesses you’re keeping a close eye on.
We'll be dissecting three financial services companies that have piqued your interest: S&P Global (SPGI), BlackRock (BLK), and OTC Markets Group (OTCM).
And hey, if you've got a favorite company that you think deserves a spot in the limelight, don't be shy! Reach out and let us know. We're always eager to hear about the businesses you're following and the investment ideas that are making your radar light up. After all, the best investment ideas often come from sharing insights and learning from each other.
SPGI :
Business model :
S&P Global is like the Swiss Army knife of the financial world, offering a diverse range of services and data that investors and institutions can't seem to get enough of. Their revenue streams are just as varied, but here's the breakdown:
Subscriptions (55% of 2022 revenue): This is their bread and butter, the steady flow of cash from subscriptions to their essential data, analytics, and research platforms. Think Bloomberg terminal, but with extra sprinkles!
Transaction Revenue: This is their "exciting" revenue stream, tied to the ups and downs of the debt markets. S&P Global Ratings is a big name in the credit rating game, and every time a bond gets issued, they get a piece of the action.
Non-Transaction Revenue: The more "chill" side of their credit rating business, including things like credit surveillance and customer relationship fees.
Asset-Linked Fees (8% of 2022 revenue): This is where their indices shine. When investors pour money into ETFs and mutual funds that track S&P Dow Jones Indices, S&P Global gets a cut.
Sales Usage-Based Royalties (3% of 2022 revenue): Think of this as their "hit song" revenue. They license out their data and indices to other financial players who use it to create their own products.
Valuation :
2024 FCF per share is 16,5$ and price around 500$
You're getting the hang of this! This dashboard is our crystal ball, giving us a glimpse into the future returns we can expect based on different growth rates and valuations.
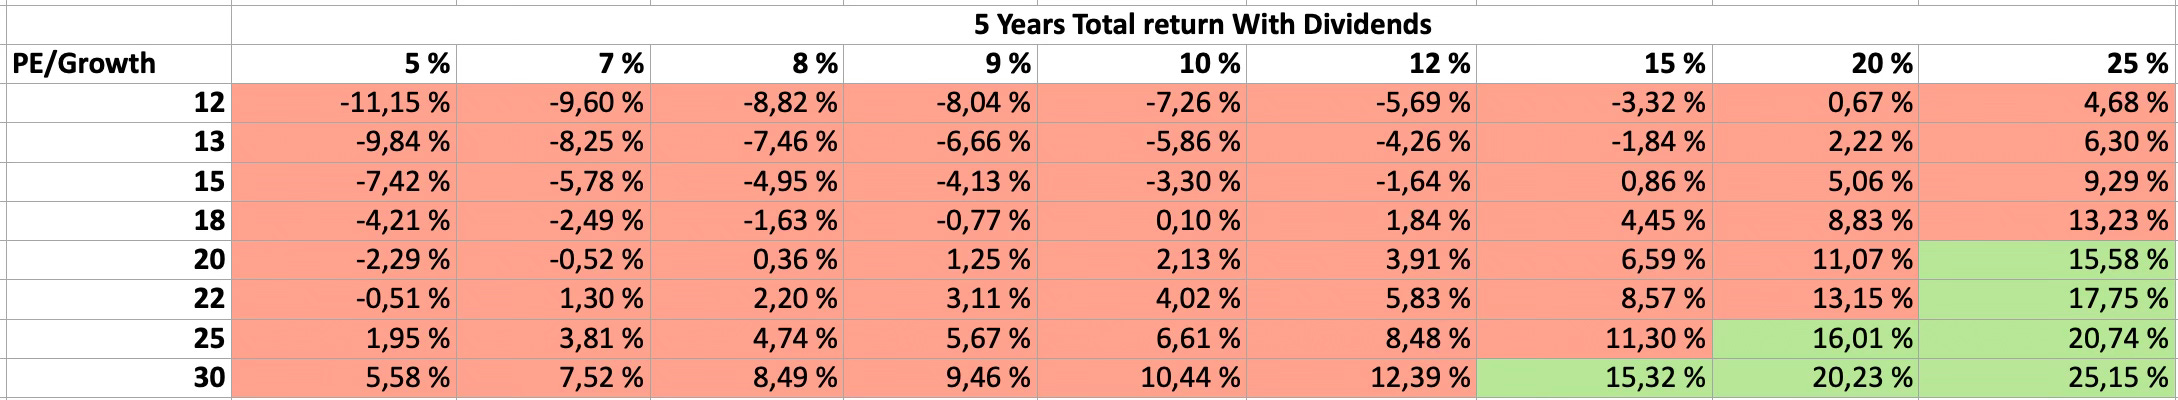
As you can see, this table shows the total return, including dividends, over a 5-year period, based on various combinations of free cash flow (FCF) per share growth rates and final price-to-free cash flow (P/FCF) multiples. It's like our investors cheat sheet, allowing us to quickly estimate the potential return of an investment based on our assumptions about its future growth and valuation.
Let's put on our financial forecasting hats and analyze the S&P Global (SPGI) scenario. If you're feeling particularly bullish and believe they can crank out a 20%+ growth rate in free cash flow per share for the next 5 years while maintaining a price-to-free cash flow multiple between 20 and 30, then buckle up! You're potentially looking at a minimum 15% CAGR. That's the kind of return that could make you want to retire early and buy that yacht you've always dreamed of.
However, here's where we inject a dose of caution. While we admire SPGI's dominance in the financial data and analytics world (they're like the Google of Wall Street), we're a bit more conservative in our growth expectations. 20%+ sustained growth for the next 5 years? That's a steep climb, even for a company as formidable as SPGI. It's like expecting our bakery to suddenly become the sole supplier of croissants to the entire country – ambitious, to say the least.
We believe a more realistic scenario is for SPGI to grow in the mid-teens, perhaps around 14-16%. Even that is impressive, and if they can achieve it while maintaining a price-to-free cash flow multiple between 20 and 25, that puts our estimated fair value somewhere in the $350-$400 range. This is where we start to get really interested, like finding a perfectly baked croissant with just the right amount of flakiness and a golden-brown crust.
Now, we could be wrong. SPGI might have some secret recipe for hypergrowth that we haven't quite figured out yet. But when it comes to investing, we prefer to err on the side of caution. It's like choosing a sturdy, reliable car over a flashy sports car that might break down at any moment. We'd rather have a comfortable ride with a high probability of reaching our destination than a thrilling but risky joyride that could end in a ditch.
So, while we acknowledge the potential for SPGI to deliver those impressive returns, we're not quite ready to bet the farm on it just yet. We'll be watching them closely, analyzing their performance, and waiting for a more compelling opportunity to jump on board, ideally closer to our estimated fair value range. After all, in the investing world, it's better to be safe than sorry (and have to sell your yacht to cover your losses).
Rating : Overvalued.
OTC Market Group :
Business model :
OTC Markets Group is like the bustling town square of the over-the-counter (OTC) securities world, where brokers, investors, and companies come together to trade and share information. They've got a few different ways of making money, kind of like a multi-talented street performer who can juggle, play the accordion, and tell fortunes (all at the same time, of course):
OTC Link ATS (Their Trading Platform): Think of this as their main stage, where broker-dealers pay a monthly fee to access the trading floor and make deals. They also charge extra for premium services, like faster data feeds and personalized trading advice (though hopefully, the advice is better than "buy low, sell high").
Market Data Licensing: They're the information brokers, collecting and organizing data on securities and issuers and then selling it to investors, analysts, and the media. It's like having a library of financial knowledge, but instead of dusty old books, they have shiny computer screens and a top-notch espresso machine.
Corporate Services: They help companies get their securities traded on the OTCQX and OTCQB markets, like a concierge service guiding them through the complexities of going public. They're the fairy godmothers of the OTC market, turning obscure companies into publicly traded entities (with a sprinkle of fairy dust and a motivational pep talk).
With this diverse revenue model, OTC Markets Group has carved out a profitable niche in the world of over-the-counter securities. They're the go-to destination for companies looking to access capital and investors seeking opportunities beyond the major exchanges.
Valuation :
2024 FCF per share is 2.35$ and price around 51$
Let’s bring back our dashboard
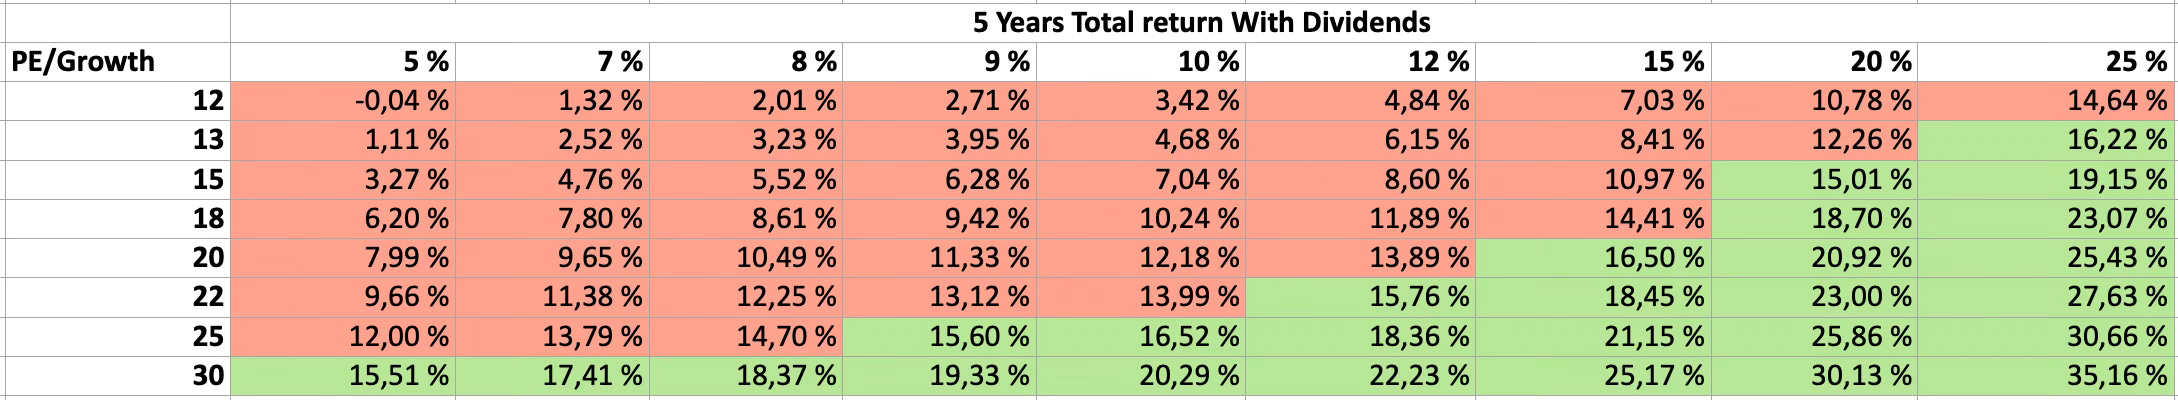
Now let's break down the OTC Markets Group (OTCM) situation. If you're feeling optimistic and believe they can keep growing their free cash flow per share at a rate of 9-12% for the next 5 years, and you think the market will give them a price-to-free cash flow multiple of 20-25, then you're essentially locking in a minimum 15% CAGR. That's like finding a golden ticket to the chocolate factory – pure sweetness!
But here's where we pump the brakes a bit. With interest rates doing their little dance these days, we think a company growing at that pace should be trading at a more reasonable P/FCF multiple, somewhere in the 15-19 range. It's like finding that same golden ticket, but realizing it only gets you access to the chocolate factory's slightly less impressive fudge room. Still good, but not quite as exhilarating.
Now, here's the thing about OTCM: their growth hasn't exactly been a smooth ride. It's more like a roller coaster, with ups and downs that could make even the bravest investor a bit queasy. This makes it tricky to predict whether they can actually hit those growth targets. It's like trying to guess where that roller coaster will be in 5 minutes – you might have a general idea, but there's always a chance it'll throw you for a loop.
So, where does that leave us? Well, we're intrigued by OTCM, but we're not quite ready to jump on board just yet. We're keeping a close eye on them, waiting for a more attractive entry point. Our ideal buy price would be somewhere in the $40-45 range, where we feel the risk-reward ratio is a bit more in our favor. It's like waiting for that roller coaster to slow down a bit before hopping on – we want to enjoy the ride, but we also want to make sure we don't lose our lunch in the process. We’ll bring you our deep dive this Thursday!
Rating : Doesn’t look overvalued but needs a deep dive.
Blackrock :
Business model :
BlackRock is like the grand conductor of the financial orchestra, managing trillions of dollars in assets and wielding immense influence in the investment world. They've got a few main ways of making those sweet, sweet melodies (or should we say, returns):
Investment Management: This is their main act, where they manage money for institutions and individuals across a wide range of investment products, from mutual funds and ETFs to alternative investments like private equity and real estate. Think of them as the maestros, carefully selecting and conducting investments to create harmonious portfolios.
Technology Services: BlackRock's Aladdin platform is like the sheet music for the financial world, a powerful risk management and investment technology system used by many financial institutions. They license this platform to others, generating a steady stream of recurring revenue. It's like selling sheet music to other orchestras, allowing them to play their own tunes (but with BlackRock's guidance, of course).
Advisory Services: BlackRock also provides advice and consulting services to governments, corporations, and other institutions. They're like the wise advisors, offering their expertise to help others navigate the complexities of the financial world. Think of them as the financial Yoda, dispensing wisdom and guidance to those seeking to master the force of investing.
With this trifecta of revenue streams, BlackRock has become a dominant force in the asset management industry. They're the conductors, the composers, and the advisors, all rolled into one.
Valuation :
EPS 2024 : 43$ Price around 1000$
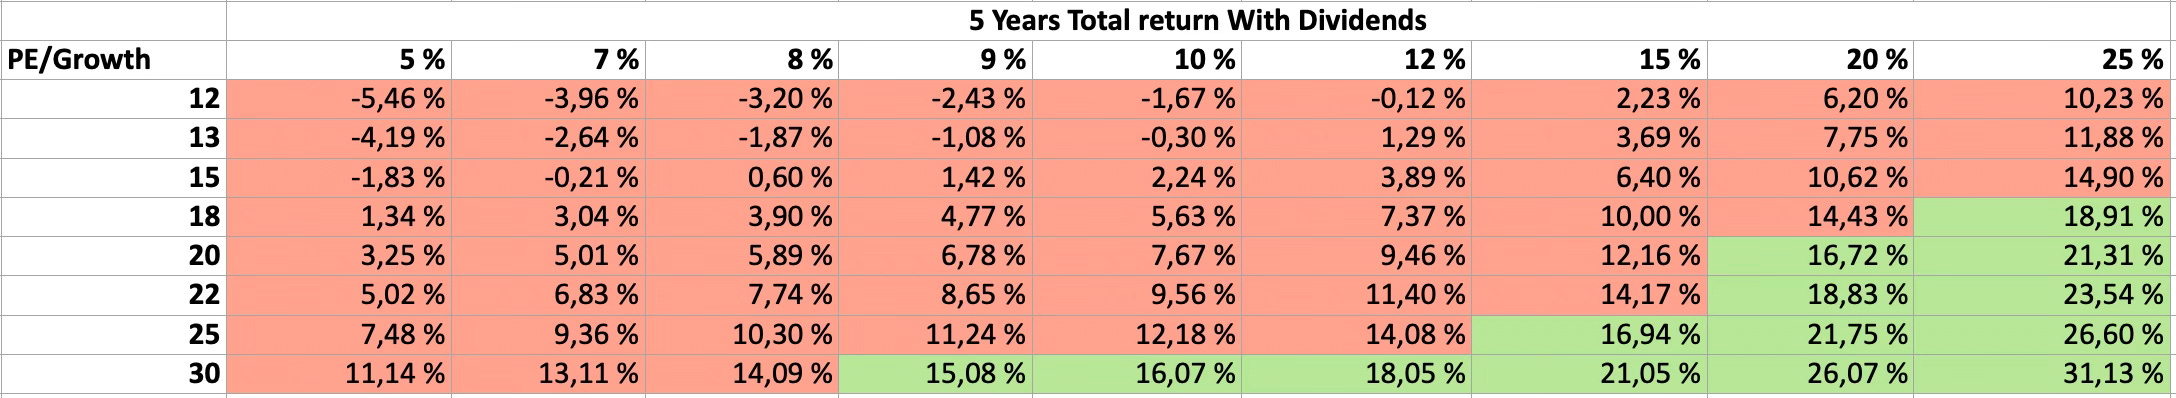
Okay, let's translate those numbers into plain English, shall we? If you're convinced that BlackRock (BLK) can pull a rabbit out of its hat and grow its free cash flow per share by a whopping 15-20% every year for the next 5 years, and you believe the market will reward them with a price-to-free cash flow multiple of 20-25, then congratulations, my friend! You're looking at a potential 15% compound annual growth rate (CAGR) at the very least. That's enough to make even the most seasoned investor do a little happy dance.
But here's the thing: while we admire BlackRock's prowess in the financial world (they're like the Jedi masters of asset management), we're a bit skeptical about those growth numbers. Imagine the sheer volume of cash they'd need to rake in each year to achieve that kind of growth! It's like expecting our bakery to suddenly start selling a million croissants a day – it's not impossible, but it's a tall order.
To give you some perspective, let's take a peek at their historical track record. Over the past 10 years, their revenue has grown at a respectable 8.2% per year, and their earnings per share (EPS) have clocked in at a decent 9.2% growth rate. Not too shabby, but not quite the rocket-fueled growth we're looking for.
Now, don't get us wrong, we love BlackRock's business and the sector they operate in. But those growth numbers just don't tickle our fancy enough to pull the trigger. It's like finding a delicious cake with a slightly stale frosting – it might still be good, but it's not quite tempting enough to justify the price.
In our book, paying 23 times earnings for a company that's growing its EPS at 9% is like paying extra for those fancy sprinkles on your cupcake when you're really just craving the cake itself. To justify that kind of valuation, we'd need to see EPS growth closer to the 15% range. Otherwise, we're better off looking for tastier treats elsewhere.
Rating : Overvalued.
Loved this?
Then share it and subscribe, for the love of all that is holy! My family is threatening to eat me if I don't bring home the bacon (or the clicks)!
We've got fresh articles dropping every Tuesday and Thursday! Tuesdays are your day for a FREE dose of market magic, covering everything from the hottest trends to personal finance tips (we'll even throw in the occasional meme, just for kicks). But hold onto your hats, because Thursdays are for our premium subscribers ONLY! That's when we unleash the DEEP DIVE – earnings calls, hot-off-the-press reports, and all the juicy market happenings you need to know, served up with a side of serious analysis. So, grab your free Tuesday treat, and then consider joining the club for the Thursday feast!
Disclaimer: The information provided in our analyses and reports is for informational and educational purposes only and should not be considered investment advice. We are not financial advisors, and nothing we say or write should be construed as a recommendation to buy or sell any security.
While we strive to provide accurate and insightful information, we make no representations or warranties of any kind, express or implied, about the completeness, accuracy, reliability, suitability, or availability with respect to the information presented.
It is important to note that we may or may not hold positions in the companies we discuss. Any opinions expressed are our own and are subject to change without notice.
Always conduct your own thorough research and consult with a qualified financial advisor before making any investment decisions. Never invest more than you can afford to lose.