

The S&P 500 Is Fine. Your Portfolio Isn't. That's Normal.
On the strange comfort of a market that has quietly become a one-stock show

If you opened your brokerage app this year and felt like something was quietly wrong, you weren’t imagining things. The index is up. Your stocks are flat. And no, your stock-picker didn’t suddenly forget how to stock-pick. The market is simply doing something it has never quite done before, at this scale, for this long.
Let’s start with the numbers, because they are genuinely extraordinary.
In 2025, the S&P 500 returned 17.9%. Three consecutive years of double-digit gains. Impressive! Comforting! The kind of returns that make financial advisors look wise and index fund enthusiasts insufferable at dinner parties. But here’s what that headline number hides: just seven stocks generated 52% of that return, and a single chipmaker named Nvidia accounted for 15.5 percentage points of the full-year gain all by itself.
One company. One-sixth of the gains across 500.
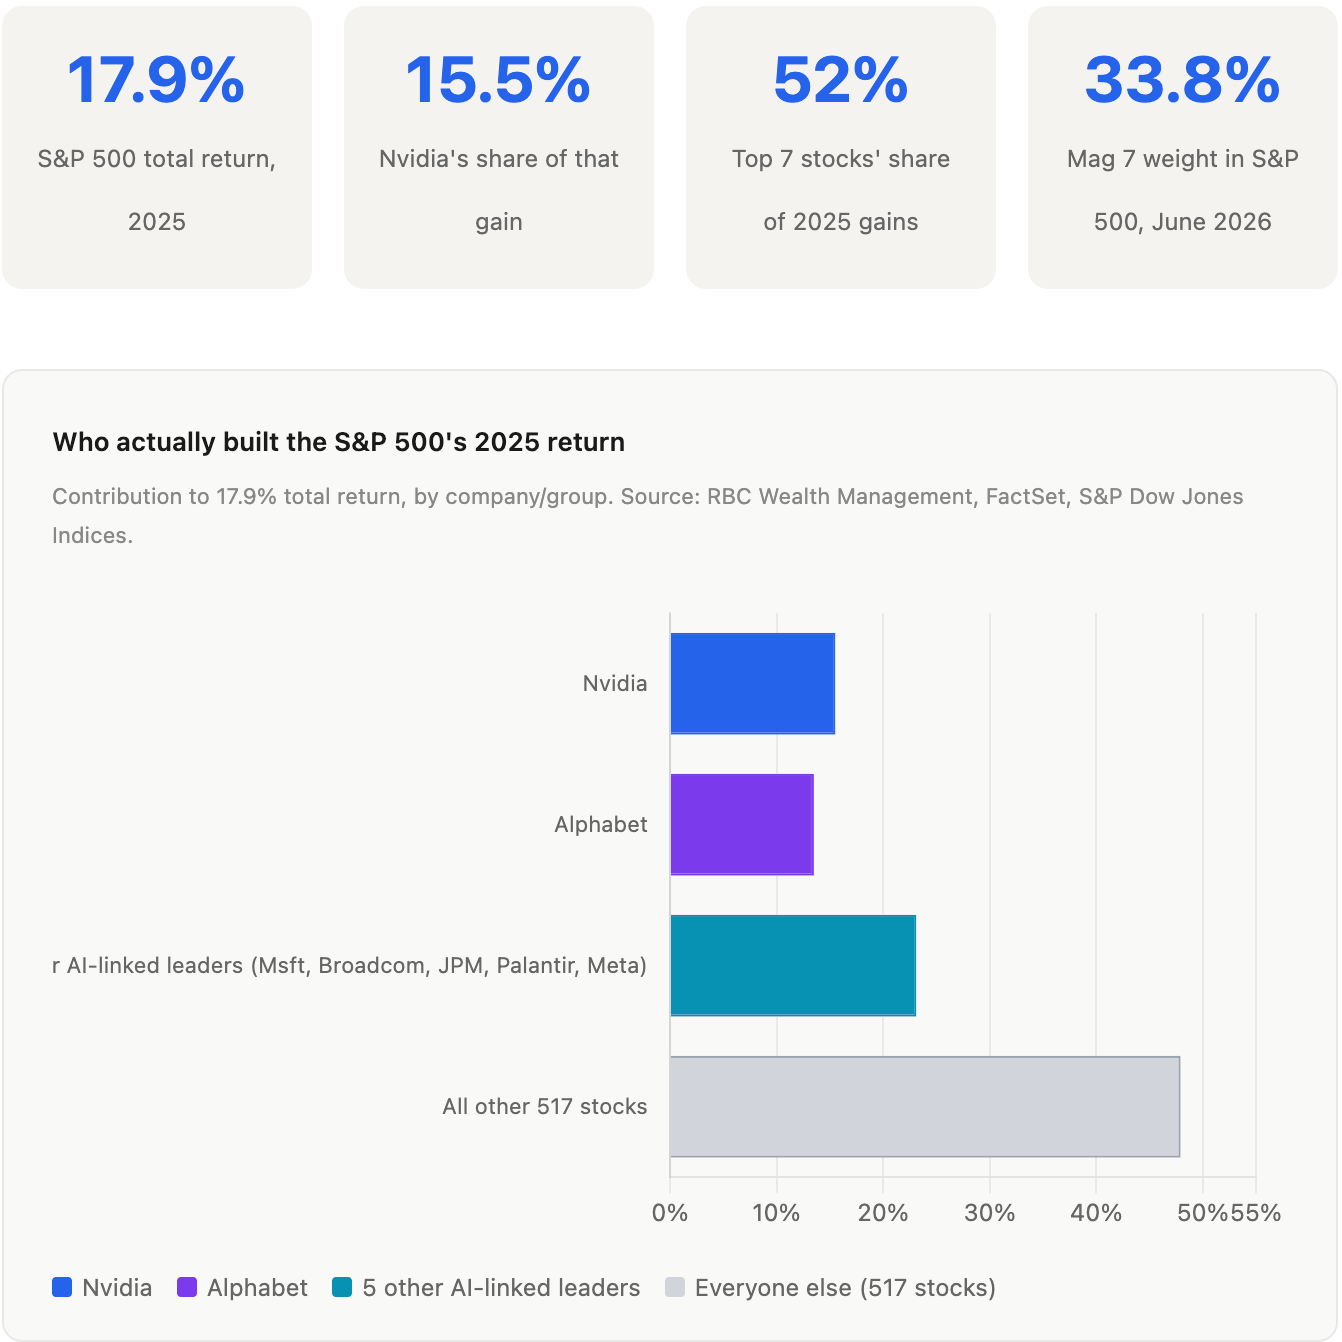
I’ve spent more time than I’d like staring at these contribution charts, and every time I come back to the same thought: this is not how an index is supposed to work. The whole point of a 500-stock index is diversification of outcomes. What we have now is closer to a 7-stock index with 493 passengers along for the ride.
The tech and communications sectors alone, the home of Nvidia, Alphabet, Microsoft and their AI-adjacent neighbors, were responsible for 63.1% of the S&P 500’s total return in 2025. Strip them out and the rest of the index returned around 6% for the year. Not bad! But also: not what you were celebrating in January.
A market-cap-weighted index is not what people think it is
Most people who invest in the S&P 500 think they’re buying “the American economy.” And in some broad, impressionistic sense, they are. But the index isn’t 500 equal slices of America Inc. It’s weighted by market capitalization, which means the biggest companies have the most influence over the number you watch on CNBC.
As of early June 2026, the Magnificent Seven, (Apple, Nvidia, Microsoft, Alphabet, Amazon, Meta, Tesla), control 33.8% of the index. The top 10 companies, which add in JP Morgan, Broadcom, and Berkshire Hathaway, make up nearly 40% of the whole thing. The remaining 490 companies share the other 60%.
Now here’s the thing about that math. Nvidia alone has more influence over the S&P 500 than Clorox, Nordstrom, and approximately 350 other companies combined. It’s not manipulated or rigged. It’s just how market-cap weighting works when one company becomes extraordinarily large. Amazon’s market cap in April 2026 sat at $2.2 trillion, making it 3.8% of the entire index all by itself. These aren’t outliers distorting the system. They are the system.
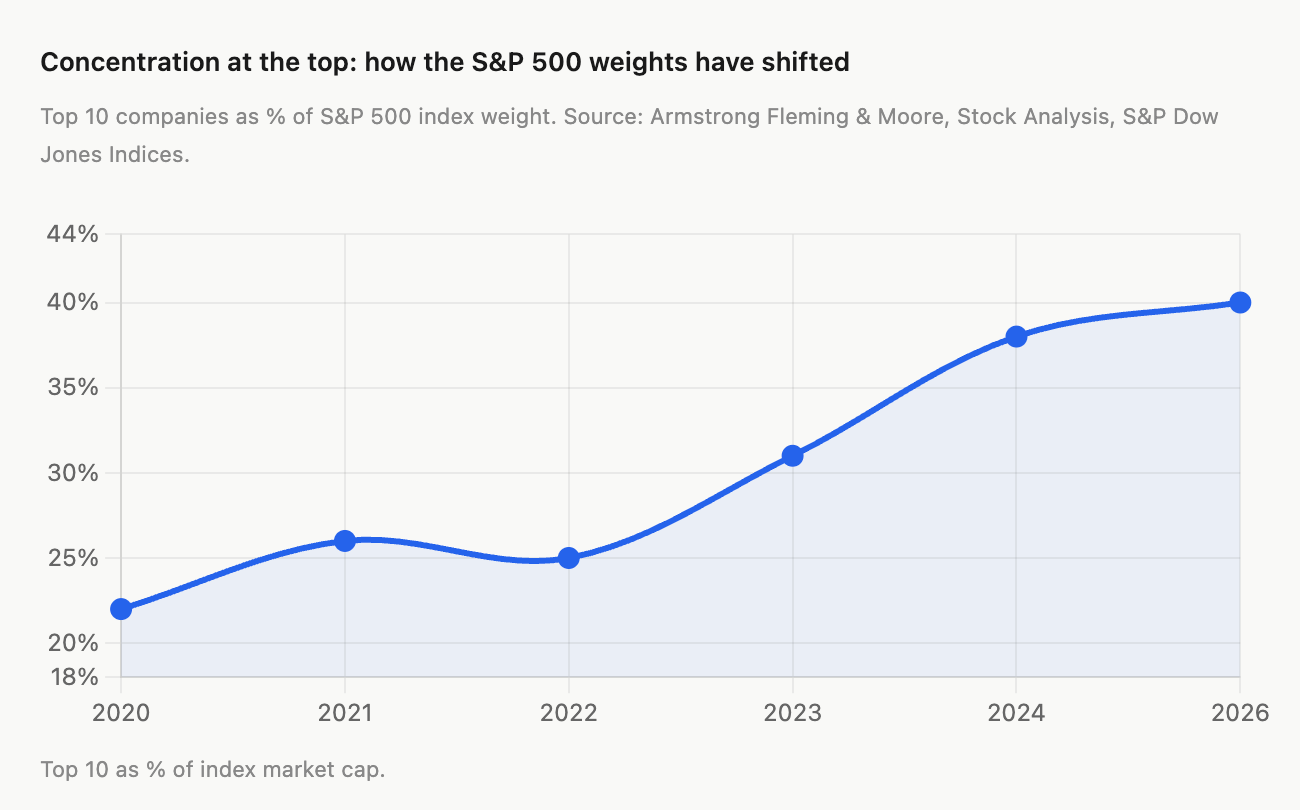
That's a journey from 22% in 2020 to nearly 40% today. In six years. To put it another way: in 2020, buying the S&P 500 gave you roughly equal-ish exposure to the full economy. Today, it gives you a large-cap tech fund with some healthcare and bank stocks mixed in.
Why your stocks are flat, and why that’s the honest result
And yet. The average investor looking at their portfolio in 2026 isn’t seeing 12% gains. They’re seeing something like flat. Maybe mildly positive. Maybe some red. And they’re confused, because the headlines keep saying things are fine.
Here’s the explanation, and it’s almost insultingly simple.
If you own a diversified portfolio of stocks that isn’t extremely overweight on a handful of AI names, you own something close to the “equal-weighted” version of the market. The S&P 500 Equal Weight Index, where every stock gets the same 0.2% slice regardless of market cap, has actually outpaced the standard S&P 500 by roughly 5 percentage points so far in 2026. That gap is being driven by the largest tech names dragging down the cap-weighted index this year, after years of leading it higher.
Your portfolio of “regular” stocks, the industrials, mid-caps, healthcare names, financial companies that don’t yet have an AI story, behaved a lot like the equal-weighted index in 2023, 2024, and 2025. Which means it lagged the cap-weighted S&P 500 by a wide margin, because the cap-weighted index was essentially Nvidia with a hat on.
In 2023, only 27% of S&P 500 stocks outperformed the index. In 2024, 28%. That's the second narrowest market in nearly three decades, the first being 1999.
Let that land for a second. Two out of three stocks in the S&P 500 underperformed their own index in 2023. Nearly the same in 2024. One of those numbers is wrong, and I don’t think it’s the breadth figure. The index has simply been doing something that a portfolio of, say, 20 to 30 reasonably chosen stocks almost can’t replicate unless those stocks happen to be Nvidia, Alphabet, Meta, Microsoft, and a few friends.
This is not your fund manager failing. This is not stock selection going wrong. This is math.
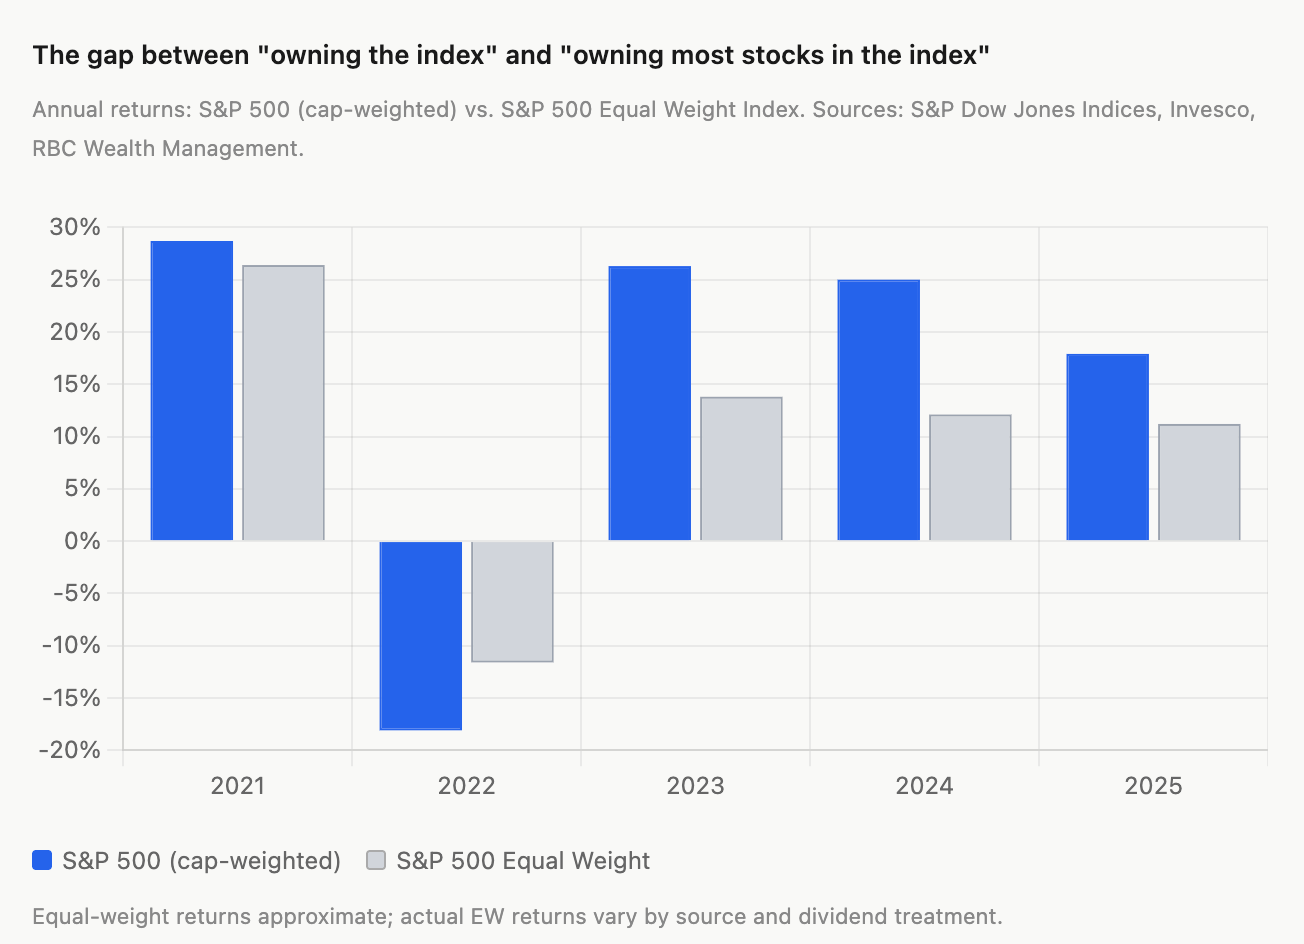
The gap in 2023 was staggering. The cap-weighted index returned 26.3% while the equal-weighted version returned around 13.8%. A nearly 13-point spread. If you owned a portfolio that “felt” well-diversified, you were in the equal-weight world, not the cap-weight world. You didn’t lose money. You just didn’t happen to own the one thing that mattered.
The AI capex cycle is real, and it is doing the work
Now. Let’s be honest about why this happened, because “AI hype” is too easy and also not quite right.
The Magnificent Seven’s 2025 earnings grew more than twice as fast as the rest of the S&P 500. Forward estimates for 2026 show the same trajectory. This isn’t just narrative: the capital expenditure numbers are extraordinary. Microsoft, Alphabet, Meta, and Amazon collectively spent hundreds of billions on AI data center infrastructure in 2025, funding an entire ecosystem of chip suppliers, power companies, construction firms, and cooling systems.
Nvidia’s Q4 2025 revenue guidance sat at $65.7 billion. That’s a 67% year-over-year increase. Strip Nvidia out of the information technology sector and earnings growth falls from headline figures to something far more modest. One company is genuinely, measurably driving a huge portion of US corporate earnings growth right now.
That’s a useful data point. Because it means the concentration isn’t just about sentiment, and it isn’t just about multiple expansion. Most of 2025’s S&P 500 return was actually driven by real earnings growth. Over 75% of the 17.9% gain came from EPS growth rather than from investors simply paying more for the same earnings. Which is what made 1999 dangerous. Then, P/E ratios were expanding into the stratosphere on companies with no earnings at all. The Mag 7 today trade at roughly 28x forward earnings on average, elevated but nothing like the 66x multiple the largest stocks commanded at the 2000 peak.
Fidelity made this comparison explicitly. The current situation is fundamentally different from dot-com, they argued, because today’s AI leaders have real cash flow, real balance sheets, and real products with real enterprise demand. This is a legitimate argument. It doesn’t mean nothing can go wrong. It means the floor is probably higher than the skeptics think.
The risk that actually keeps me up at night (and it’s not the one you expect)
The obvious risk is the bubble risk. Everyone mentions it. The S&P 500 concentration chart looks eerily similar to the late 1990s. The equal-weight versus cap-weight spread has reached extremes not seen since 1999. This comparison gets made a lot in financial media, and it’s not wrong to make it.
I’ll be honest: I find the bubble argument less compelling than I did two years ago. Nvidia generates actual profits. Alphabet’s AI search integration is working. Meta’s ad business is humming. These companies aren’t burning through venture capital on unproven business models. They’re buying GPUs to serve paying enterprise customers who have signed contracts. When the dot-com bubble burst, many of the largest companies had no earnings path at all. That is not true today.
The risk that I keep coming back to, and that I think deserves far more attention than it gets in the standard “risks to the thesis” paragraph, is the rotation risk. Not whether the AI bubble bursts, but what happens if the AI trade simply moderates.
Here’s why this matters more than it sounds. If Nvidia grows “only” 25% next year instead of 67%, and if the Mag 7 go from growing earnings at twice the rate of the S&P to merely matching it, the concentration dynamic reverses without any crash. No drama. The index just starts returning less than the average stock instead of more. And every investor who spent the last three years being told they were “underperforming the market” discovers that, actually, their boring diversified portfolio was fine the whole time.
This rotation is already happening in pockets. The S&P 500 Equal Weight Index outperformed the cap-weighted index by 3% in the three months ending January 2026. The small-cap S&P 600 outperformed the full S&P 500 by 4% in a single month. The breadth indicators that analysts use to measure whether the rally is broad or narrow have been improving. Sectors that had nothing to do with AI, utilities, financials, industrials, started showing up in 2025 returns.
Now here’s what makes rotation genuinely dangerous for certain investors. If you’ve been chasing the AI trade by increasing your weight in mega-cap tech to “keep up with the index,” you’ve done exactly the wrong thing at exactly the wrong time. You bought concentration at the moment when concentration is most likely to mean-revert. The people who did nothing, who held their diversified portfolios and shrugged at underperformance, may end up being the ones who look smart by 2028. I’m not predicting a crash. I’m describing a dynamic where patience is the entire position.
There’s also the earnings revision risk, which is quieter but worth watching. The top ten S&P 500 companies represent 40% of the index’s market value but only 31% of total earnings. That gap has to close somehow, either through earnings growing into valuations or through valuations compressing and historically, gaps like this close more often through the latter.
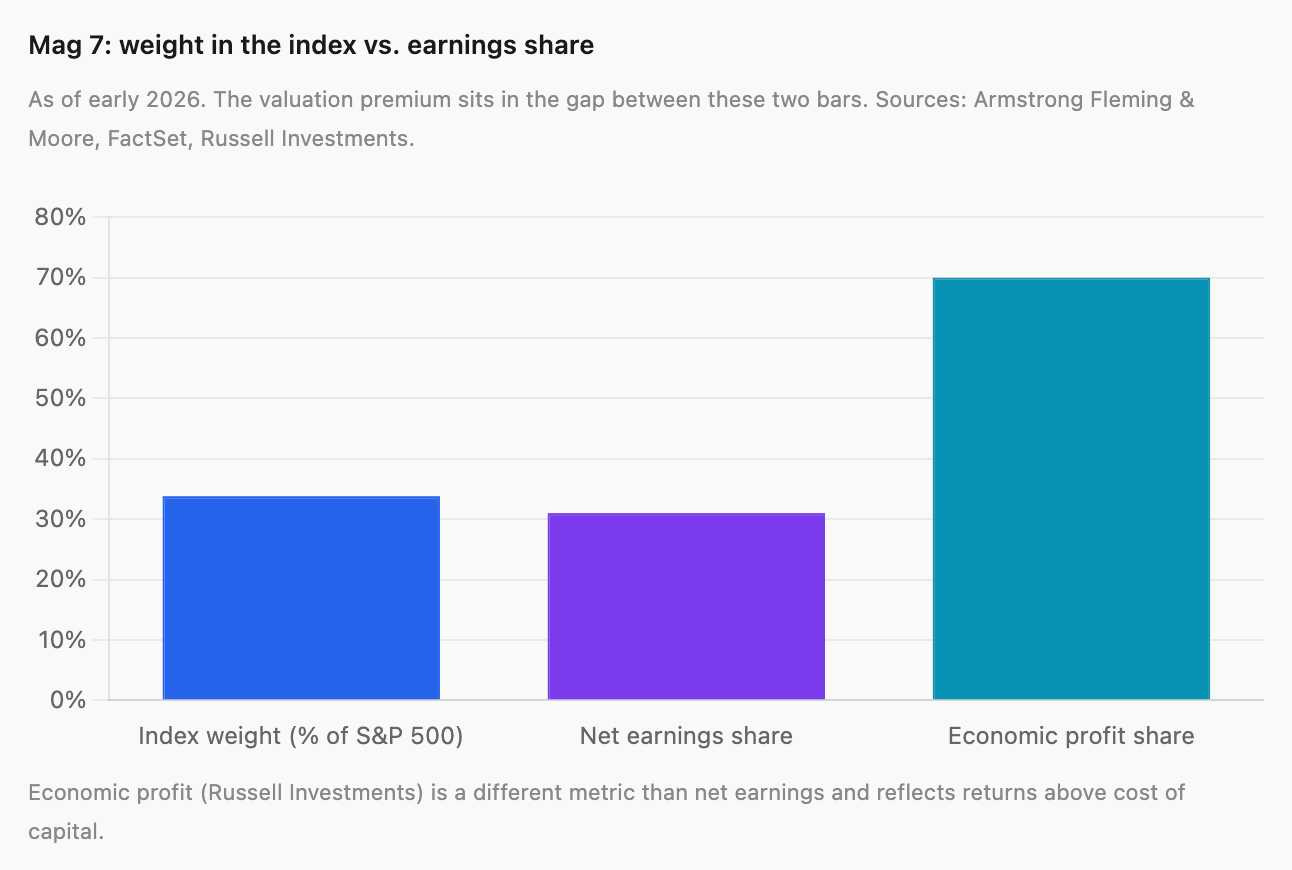
The one genuinely reassuring data point in that chart is the economic profit figure. Russell Investments estimates that the Mag 7 generate nearly 70% of the total economic profit produced by S&P 500 companies, meaning returns above their cost of capital. On that measure, their weight in the index looks almost cheap relative to their contribution. The market is paying a 33.8% weight for companies producing 70% of the real value creation. That’s a different story than 1999, where index weight was entirely decoupled from any reasonable profit metric.
What this means if your portfolio is flat
Simply: it means your portfolio behaved like most stocks behave. Not like a portfolio that happened to be 30% Nvidia.
The S&P 500 you see on Bloomberg or Yahoo Finance is not the average stock. It is the market-cap-weighted average, which means it is, right now, a heavily AI-tilted large-cap technology index wearing the costume of a broad market benchmark. Comparing your returns to it is like comparing your jogging time to someone who took an electric scooter.
This doesn’t mean you should run out and buy Nvidia. The easy money in that trade was made in 2023 and 2024. What it does mean is that you shouldn’t misread your portfolio’s recent underperformance as evidence that you’ve done something wrong. There are about 370 stocks in the S&P 500 right now that have underperformed the index in 2025. If you own any of them, you’re in very crowded and very reasonable company.
The professionals aren’t immune either. In 2023, just 27% of individual S&P 500 members outperformed the index itself. That’s the narrowest market breadth since at least 1995. Any active manager who didn’t happen to be very overweight the right five or six names looked like they were failing at their job. Most of them weren’t failing. They were just not running a Nvidia index fund with extra steps.
The rotation: slow, painful, and probably already starting
By early 2026, something has quietly shifted.
The Mag 7 as a group have underperformed the S&P 500 so far this year, growing 5.4% collectively through mid-June versus the index’s 7.9%. Within the group there’s massive dispersion: Alphabet is still running, while Microsoft and Tesla have dragged. The concentrated leadership is fragmenting. Amazon was up 3.4% year-to-date as of late May. Alphabet was up 8.5%. Meta up 4.8%. But Apple, Microsoft, and Tesla were lagging.
The equal-weight ETF (RSP) has outpaced SPY by nearly 5 percentage points in 2026. The small-cap S&P 600 has been on a tear. The Wall Street Journal ran a piece in January headlined “Small Stocks Finish Week at Records.” Breadth is expanding. The concentration in the top 10 has dipped slightly below 40% from its peak.
This is what a slow rotation looks like. It doesn’t feel like a crash. It feels like: “Hm, my portfolio is actually doing fine relative to the index this year.” And then you realize the comparison finally makes sense again.
Goldman Sachs published its 2026 outlook predicting that the Mag 7 would trail the equal-weight S&P 500, framing it as a shift toward “broader market opportunities.” Ed Yardeni went on CNBC and told investors to be underweight the Mag 7 and overweight the “Impressive 493.” These aren’t crank calls. They’re mainstream reads from credible analysts who see the same mean-reversion math that the charts have been whispering about for two years.
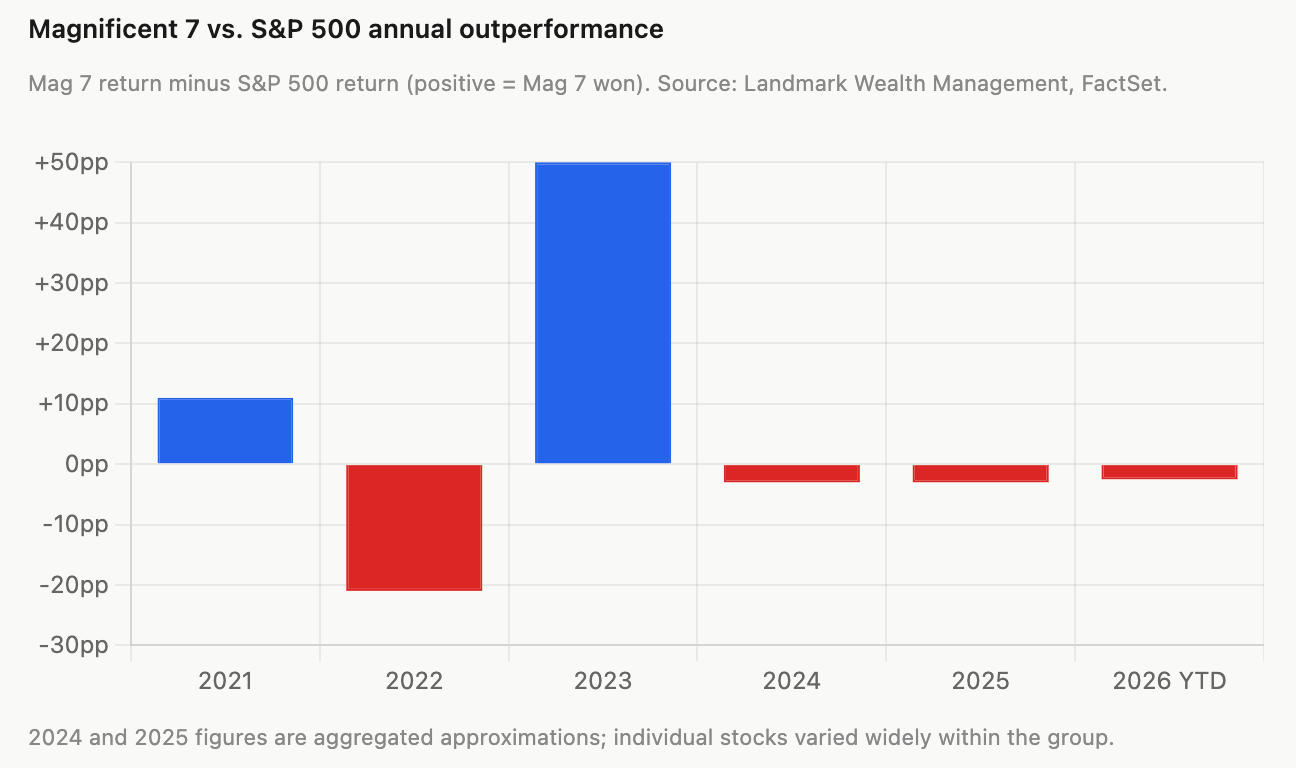
The chart above is the one I find most instructive. The Mag 7’s gigantic outperformance in 2023 was basically a catch-up from the ugly 2022. After periods of extreme concentration, history suggests mean-reversion. The only prior period where the 3-year cap-weight versus equal-weight spread reached this level was late 1999 and early 2000. What followed wasn’t necessarily a crash in the leaders. It was a decade of the rest catching up.
The question you should actually be asking
Not “why is my portfolio underperforming?” but “what am I actually benchmarking against, and does that benchmark make sense for me?”
The S&P 500 is the right benchmark if you own an S&P 500 index fund. It is a deeply weird benchmark if you own a diversified portfolio of individual stocks or sector funds or anything that doesn’t replicate the index’s exact composition. For most individual investors, the equal-weighted S&P 500 is a much more honest comparison. And against that comparison, the last three years look a lot less alarming.
The practical portfolio question is whether to chase the AI concentration or wait it out. A lot of smart money managers are doing what Benzinga described: “keeping a core position in a low-cost cap-weighted fund for benchmark tracking, while adding equal-weight exposure to dilute concentration risk.” That’s a hedged, sensible position. It acknowledges both that the AI trade has legs and that the concentration is historically extreme.
What this looks like from inside a portfolio with zero AI stocks
Let me be specific. My portfolio holds no Nvidia, no Microsoft, no Alphabet, no Meta. What it does hold is a cluster of financial services companies: American Express, S&P Global, Mastercard, Brookfield Asset Management. The kind of names that show up on value investor reading lists, not on AI bubble watchlists. Businesses with real moats, steady earnings growth, and the slightly boring quality of being genuinely good at what they do.
In 2026, this portfolio is lagging the S&P 500. Not dramatically. Not in a way that should cause anyone to lose sleep. But lagging.
Now here’s the thing about that. I’m completely fine with it.
Not because I’m stoic or because I’ve somehow transcended the very human urge to compare. I’m fine with it because I’ve looked at what these companies actually do, how they’ve actually performed over the long arc, and what the math looks like when you zoom out past the current AI moment. The short-term gap between my portfolio and the S&P 500 headline number is real. It’s also, I think, close to meaningless as a signal about whether I’ve made good decisions.
Take Mastercard. Over the past ten years, MA has delivered an annualized return of around 18.7%, compared to roughly 13.3% for the S&P 500. That’s five percentage points per year of compounding outperformance over a decade, the kind of gap that turns a $100,000 investment into very different outcomes depending on which side of it you’re on. A thousand dollars invested in MA stock twenty years ago would be worth close to $121,000 today, good for an annualized return of more than 27%, versus about $8,600 from an S&P 500 index fund.
The catch, which any honest Mastercard observer will tell you, is that 2026 has been rough. Mastercard is down roughly 13% year-to-date. Berkshire Hathaway, which held both Mastercard and Visa since 2011, sold its stakes in both during Q1 2026. Make of that what you will. But the two-decade return is not a fluke. It’s what a near-monopoly on the plumbing of global consumer spending produces over time.
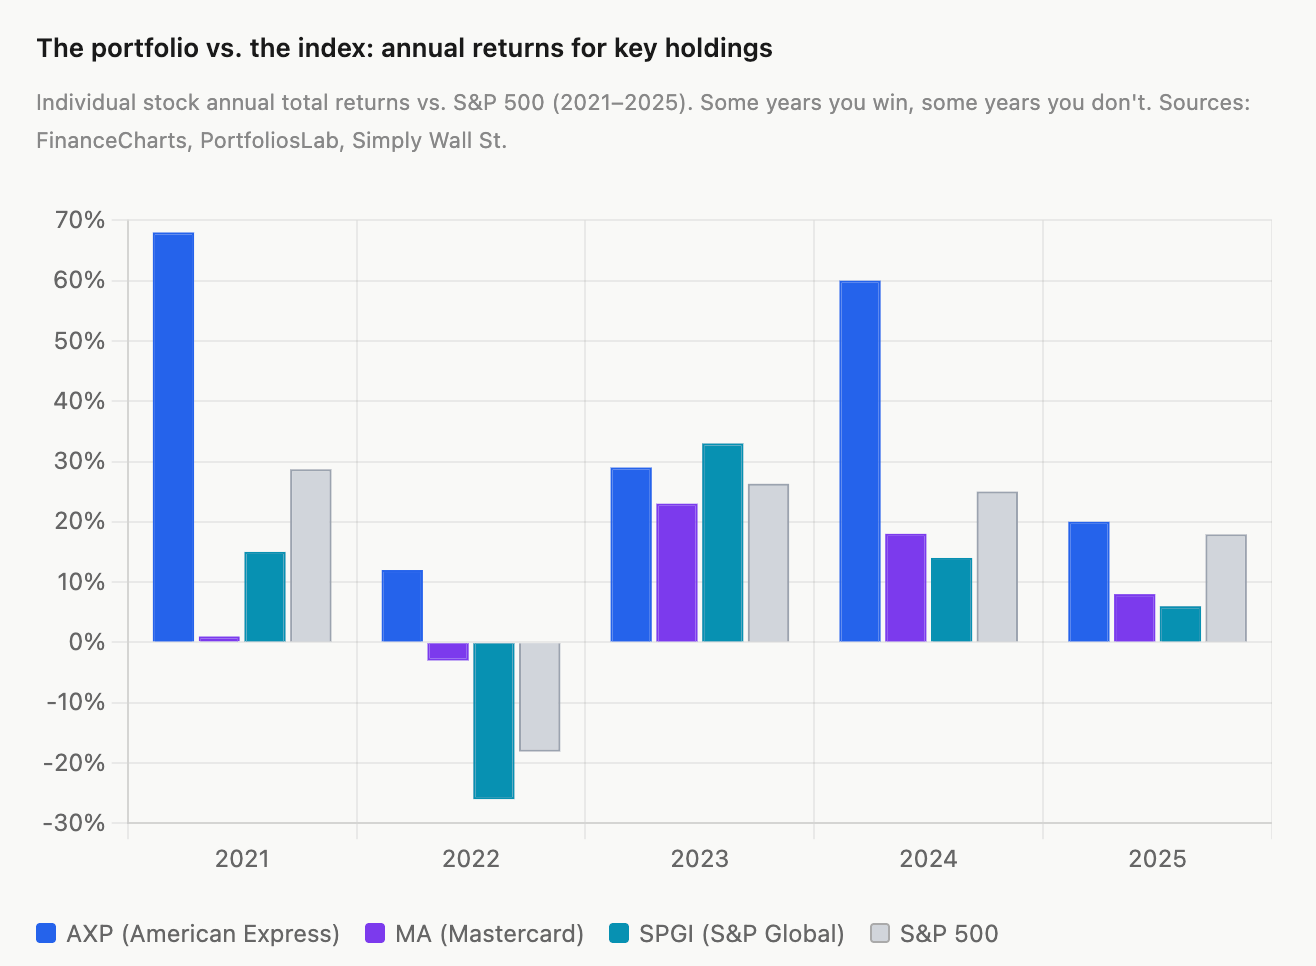
American Express is the portfolio’s clearest example of what patient ownership looks like in practice. The stock returned 60% in 2024 and has delivered 15%+ EPS growth annually. Q1 2026 results showed revenue up 12% and net income up 15% year-over-year, with EPS beating analyst estimates by over 7%. AXP’s consensus EPS estimates for 2026 and 2027 project 13.9% and 14.7% growth, respectively, with four upward revisions to estimates in recent months. This is a company that has found a way to keep growing its premium cardholder base while the broader consumer shows stress. The Centurion card network isn’t being disrupted by AI. Neither is the habit of well-off people spending money on travel and dining.
S&P Global is a slightly different story. It’s had a weak year. SPGI’s 10-year total return sits at 387%, against a far lower figure for the index, and its 20-year annualized return is 12.8%. But 2025 was only 5.7% and 2026 has been rougher. The company is spinning off its Mobility division, navigating macro headwinds, and dealing with the fact that bond issuance slowed. None of these are existential threats to a company that literally licenses the benchmarks every index fund in the world is measured against. You can argue about their short-term earnings trajectory. You cannot really argue that their product is going away.
Brookfield Corporation, the newest and most interesting addition, manages over a trillion dollars in real assets: infrastructure, renewable power, private credit, real estate. BAM has around $539 billion in fee-bearing capital and is expected to grow earnings 15 to 18% in 2025, with S&P rating it A-minus with a stable outlook. The business model is essentially a toll on global capital flows through alternative assets, which is a very good place to be when rates are elevated and institutional investors are desperately looking for yield outside public equities.
The common thread through all of these names is that they are, in different ways, infrastructure businesses. Not infrastructure in the literal pipes-and-cables sense, although Brookfield owns plenty of those. Infrastructure in the sense of being embedded in processes that don’t stop. Every time a payment moves through a card network, Mastercard gets paid. Every time a bond gets issued, S&P Global rates it. Every time an institution allocates capital to alternatives, Brookfield charges a fee. These aren’t exciting narratives. They’re not getting anyone on a fintech podcast. But they compound.
And yet. The honest version of owning these stocks in 2023, 2024, and early 2025 is that you watched the S&P 500 sprint past you at a pace that felt almost personal. When the index is up 25% and your portfolio is up 12%, you don’t feel like a patient long-term investor. You feel like someone who bet on the tortoise and is watching the hare disappear over the horizon.
The answer to that feeling isn’t to panic. It’s to remember what the 10-year numbers actually look like on these businesses, and to remember that the hare spent 2022 getting destroyed while the tortoise merely had a bad year. Over a full market cycle, quality compounders with durable moats and consistent earnings growth tend to close the gap. The S&P 500’s recent outperformance was heavily distorted by a small handful of names in a very specific moment. That moment will pass. These businesses will still be collecting their tolls.
The five-year game is the one I’m playing. Not the six-month game. Not the “why isn’t this keeping up with Nvidia” game, which is a game you can only win by owning Nvidia, and which you almost certainly would have lost at some earlier point by owning it at the wrong time.
Underperforming the S&P 500 in a given year, when that index is a de facto Nvidia fund with extras, is not a judgment on the quality of the underlying businesses. It’s just a statement about what the market chose to reward in that specific window. The market can be wrong about that for longer than feels comfortable. But it corrects.
Where I land
I’m long the broader market, and specifically long the idea that the next three to five years look better for the “Impressive 493” than the last three did.
Not because AI is going away. The data center build-out is multi-year. Nvidia’s demand is still “off the charts” per Jensen Huang. The hyperscalers are spending at a rate that has no historical precedent. The AI earnings cycle is real and durable.
But the easy outperformance trade in the Mag 7 required not just that these companies do well, it required that they do well while everything else treaded water. That dynamic is harder to maintain when the equal-weight index starts beating the cap-weight one. When small caps are breaking to records. When the breadth is expanding and the dispersion inside the Mag 7 itself has become enormous.
The most boring version of the next few years is that AI stocks deliver okay returns, the rest of the market delivers okay returns, and the gap between them shrinks. Your diversified portfolio stops looking like it’s broken. The S&P 500 headline number becomes a slightly less misleading representation of what you actually own.
That’s probably the outcome. Not a crash. Not a rotation into chaos. Just: mean reversion. Which, in markets, is usually the most likely thing and somehow always the most surprising.
If this article resonated with you, you might like Investing with Eagles.
The portfolio I described above, financial services companies with durable moats, patient long-term ownership, ignoring the noise, didn’t come from gut instinct. It came from a framework. My book Investing with Eagles walks through exactly how I analyse companies, read financial statements without falling asleep, identify genuine competitive advantages, and estimate what a business is actually worth. It’s a value investing book, but not a stuffy one. Think less accounting textbook, more honest conversation about how to find great businesses and hold them long enough to let compounding do its job. If you’ve read this far and nodded along at the part about owning quality names and waiting out the Nvidia years, this is probably the book for you.