

The Earnings Yield Gap: An Epic Saga of Stocks vs. Bonds
Alright, buckle up buttercup, because we're about to dive deep into the wacky world of the Earnings Yield Gap!

Get access to our Stock deep dives and much more for 8$ a month or 80$ a year ... That's less than your daily latte, and this could actually make you richer! (No promises, but hey, we've got charts and graphs and stuff. Looks pretty official.) 📈
The Earnings Yield Gap: A Deep Dive into the Numerical Wonderland!
Imagine yourself on the trading floor of the New York Stock Exchange, a whirlwind of flashing screens, ringing bells,and frantic hand gestures. Numbers fly through the air like confetti, each one carrying the potential for fortunes made or lost. That's the electrifying atmosphere we're channeling as we delve deeper into the captivating world of the Earnings Yield Gap!
This isn't just some dry, academic concept; it's a thrilling saga of stocks versus bonds, a financial duel where numbers are the swords and shields. It's a story that has captivated investors for decades, a tale of risk and reward, fear and greed, and the eternal quest for market-beating returns.
Unveiling the Enigma: The Earnings Yield Gap in All Its Glory
Think of the Earnings Yield Gap as a financial compass, guiding you through the turbulent seas of the market. It helps you navigate the treacherous currents of investor sentiment, economic tides, and the ever-shifting sands of interest rates.
Earnings Yield: The Siren Song of Stocks
Imagine owning a tiny piece of a thriving company, a share in its triumphs and tribulations. The earnings yield is like a magical key that unlocks the treasure chest of profits. It tells you how much money your little piece of the pie is generating, like a miniature money-making machine.
Higher earnings yield? More gold coins for your coffers! It's like having a goose that lays golden eggs, but instead of eggs, it lays dividend checks and stock appreciation.
Government Bond Yield: The Steady Hand of Security
On the other side of the ring, we have the government bond yield, the reliable bedrock of the investment world. It's like lending money to your trustworthy Uncle Sam, who promises to pay you back with a little something extra for your kindness.
Think of it as a safe haven, a shelter from the storm of market volatility. It may not offer the explosive growth potential of stocks, but it provides a steady stream of income, like a gentle rain nourishing your portfolio.
The Earnings Yield Gap is the epic clash between these two titans, the difference between the allure of high-growth stocks and the comfort of stable bonds. When the gap is wide, stocks are beckoning you with promises of riches. When it's narrow,
Calculating the Gap: Crunching the Numbers
Here's the secret formula:
Earnings Yield Gap = (Earnings Yield of Stocks) - (Government Bond Yield)
Let's see it in action:
Scenario 1: Stocks are rockstars!
S&P 500 Earnings Yield: 6% (Woohoo!)
10-Year Treasury Yield: 3% (Yawn...)
Earnings Yield Gap: 6% - 3% = 3% (Stocks are partying like it's 1999!)
Scenario 2: Bonds are back in vogue!
S&P 500 Earnings Yield: 3% (Hmm...)
10-Year Treasury Yield: 5% (Ooh la la!)
Earnings Yield Gap: 3% - 5% = -2% (Bonds are the belles of the ball!)
Time Traveling Through the Gap: A Historical Perspective
The Earnings Yield Gap has a history as dramatic as a Shakespearean tragedy! Let's take a peek at some historical data:
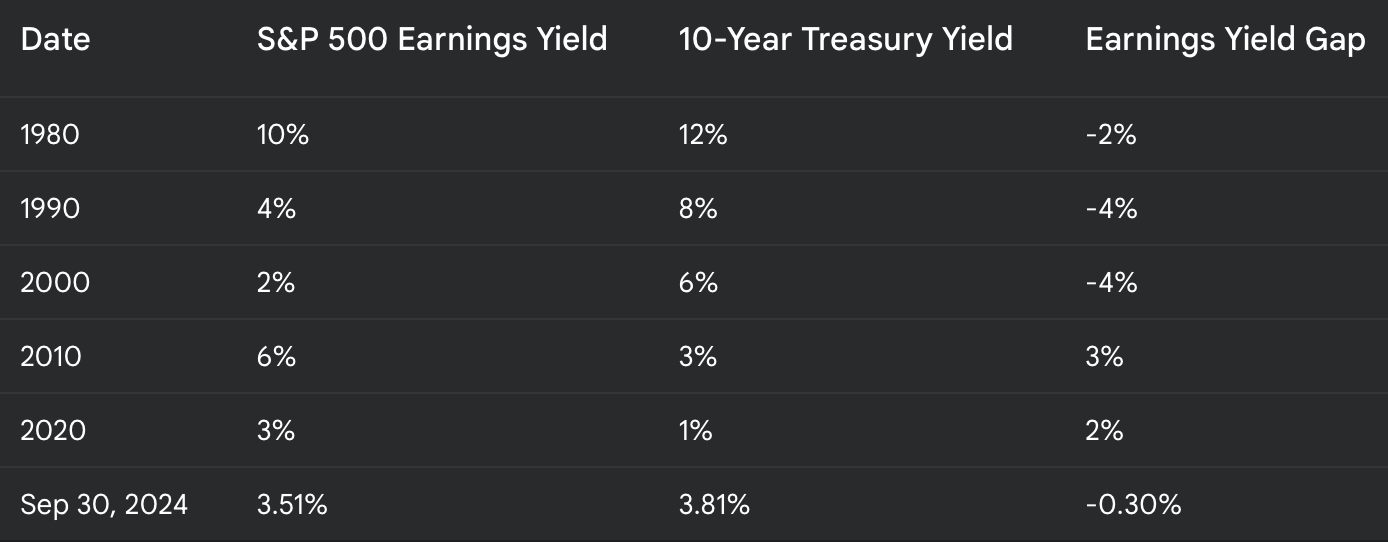
As you can see, this gap has been through thick and thin, with swings as wild as a rodeo bull! Sometimes it's positive, sometimes it's negative, and sometimes it's so close to zero, it's a nail-biting finish.
What Makes This Gap Dance?
A whole bunch of characters are pulling the strings of this gap:
Economic Growth: When the economy is booming, companies are making money hand over fist, and stocks are the stars of the show. Imagine GDP growth of 4% - the S&P 500 earnings yield jumps to 7%, while the 10-year Treasury yield stays at 3%. The gap widens to 4%, signaling a potential gold rush for stock investors.
Interest Rates: When interest rates rise, bonds become more attractive. The Federal Reserve raises rates, and the 10-year Treasury yield climbs to 6%, while the S&P 500 earnings yield remains at 4%. The gap shrinks to -2%, making bonds the new darlings.
Inflation: This sneaky villain eats away at your purchasing power. But stocks, with their ability to grow earnings and dividends, shine brighter. Inflation reaches 5%, but the S&P 500 earnings yield climbs to 8%, widening the gap to 3% and making stocks the inflation-busting heroes.
Investor Sentiment: When fear grips the market, investors dump stocks and flock to bonds. The S&P 500 earnings yield spikes to 10%, while the 10-year Treasury yield plummets to 2%. The gap explodes to 8%, signaling a potential buying opportunity for brave investors.
Using the Gap to Your Advantage
Stock vs. Bond Smackdown: A wide gap? Stocks might be the underdog ready to take the championship belt!
Mind Reading 101: The gap can give you a glimpse into the collective mind of the market. Are investors feeling greedy or fearful?
Bargain Hunting Extravaganza: Sometimes, a stock's earnings yield is so high, it's practically begging you to buy it.
Company X-Ray Vision: You can even use the earnings yield to peek under the hood of a single company. Is it a well-oiled machine or a rusty clunker?
Expert Opinions: A Battle Royale
The Earnings Yield Gap has sparked many heated debates among financial gurus. Some hail it as a crystal ball, predicting the future of stock market returns. Others dismiss it as a mere distraction. Who's right? The truth is, the gap is just one piece of the puzzle.
The Gap Today: Numbers Tell the Story
As of September 30, 2024, the Earnings Yield Gap stands at -1,50%. The S&P 500 earnings yield is 3.20%, while the 10-year Treasury yield is 4.70%. This negative gap suggests that stocks might be a bit pricey compared to bonds, but it's not the whole story.
Remember that the long-term average gap is +0.27%. So, the current gap is slightly below the historical norm, but not drastically so.
The Bottom Line: Numbers Paint the Picture
Numbers are the building blocks of the Earnings Yield Gap, the pixels that create the image of market valuations. By understanding these numbers, you can gain a deeper appreciation for the forces at play in the investment world.
But remember, numbers are just part of the story. Combine them with qualitative factors, like economic outlook, company fundamentals, and your own risk tolerance, to make informed investment decisions.
So, embrace the numbers, analyze them, and let them guide you on your investment journey. But don't forget to have fun along the way! After all, investing is a game of numbers, and games are meant to be enjoyed.
Want to keep reading?


Disclaimer: The information provided in our analyses and reports is for informational and educational purposes only and should not be considered investment advice. We are not financial advisors, and nothing we say or write should be construed as a recommendation to buy or sell any security.
While we strive to provide accurate and insightful information, we make no representations or warranties of any kind, express or implied, about the completeness, accuracy, reliability, suitability, or availability with respect to the information presented.
It is important to note that we may or may not hold positions in the companies we discuss. Any opinions expressed are our own and are subject to change without notice.
Always conduct your own thorough research and consult with a qualified financial advisor before making any investment decisions. Never invest more than you can afford to lose.