

The 10% Return: Deconstructing the Market's Most Famous Myth
Math, Myth, and Marketing: A Takedown of the Market's Most Famous Number

The claim that stocks deliver a 10% average annual return is a broadly accurate, but dangerously simplistic, summary of history. It is the financial world’s most quoted rule of thumb, a comforting mantra for long-term investors. While the long-term nominal total return of the S&P 500, the primary proxy for the U.S. stock market, does indeed hover around this celebrated figure, this "average" is a statistical phantom. It is a number that rarely, if ever, appears in the results of any single calendar year. Its elegant simplicity conceals immense volatility, the corrosive and often-ignored effect of inflation, and significant structural shifts in the sources of market returns over time. To rely on this number without understanding its composition is to navigate a stormy sea with a map that shows only the destination, not the treacherous currents and jagged rocks that lie in wait.
Strategic Planning Assumption: Through 2035, investors should anchor expectations for U.S. large-cap equities to a 6-8% nominal total return range, with real (inflation-adjusted) returns likely falling between 3-5%. This moderation is driven by a confluence of factors: historically high starting valuations that limit the potential for further multiple expansion, moderating long-term corporate earnings growth forecasts, and a fundamental shift in the dividend landscape that places a greater burden on capital appreciation to generate returns.
Key Findings Synopsis
This report deconstructs the 10% myth and provides a strategic framework for navigating the coming decade. The key findings are as follows:
The "Average" is a Lie: The actual annual return of the S&P 500 is rarely near 10%. The historical distribution of returns is incredibly wide, showing a dramatic spread of outcomes from spectacular gains of over 30% to gut-wrenching losses exceeding -30%. The market’s journey is a series of sprints and stumbles, not a steady jog.
Inflation is the Silent Thief: The headline 10% figure is a nominal return. After accounting for inflation, the real return—the number that reflects an actual increase in purchasing power—is substantially lower, historically averaging around 6.5%. Forgetting inflation is like celebrating a salary raise without noticing a simultaneous increase in the cost of living.
Dividends Matter (But Less Than They Used To): Over the grand sweep of market history, dividends have been a powerhouse, contributing nearly a third of the S&P 500’s total return. However, this critical engine of return has lost horsepower in recent decades as corporate titans, particularly in the technology sector, favor share buybacks and internal reinvestment over cash payouts. This makes future returns more dependent on inherently volatile capital gains.
The U.S. is Not the World: The S&P 500’s stellar performance over the last decade has been a uniquely American story, significantly outpacing its international peers. This period of U.S. exceptionalism has led to stretched valuations domestically and more attractive opportunities abroad, highlighting the strategic imperative of global diversification.
The Market is Top-Heavy: The S&P 500 is no longer the broadly diversified vehicle many assume it to be. Returns are increasingly driven by a handful of mega-cap technology stocks. In 2024, NVIDIA alone was responsible for nearly a quarter of the index's growth in market capitalization. This concentration creates a structural fragility, where the fate of the entire index is tethered to the performance of a few dominant players.
Deconstructing the "Average" - Averages Lie, but They Tell a Version of the Truth
The 10% figure is not a fabrication; it is a statistic. But like any statistic, it can be used to illuminate or to obscure. Its meaning is entirely dependent on the context—the timeline chosen, the handling of inflation, and the components included in the calculation. A deeper examination reveals that the number itself is less important than the forces that produce it.
The Timeline Trick: Which "History" Are We Talking About?
The "average" return of the stock market is a moving target, highly sensitive to the chosen start and end dates. The selection of a particular timeframe can paint vastly different pictures of market performance, a phenomenon that can lead to significant investor bias.
The most commonly cited figures for the S&P 500's performance date back to its modern inception as a 500-stock index in 1957. From this point through to the present day, the annualized total return has been remarkably consistent across various data sources, landing in the range of 10.3% to 10.4%. This period captures the post-war economic boom, the stagflation of the 1970s, the bull market of the 1980s and 90s, the dot-com bust, the 2008 Global Financial Crisis, and the subsequent recovery. It is this nearly 70-year history that forms the bedrock of the 10% claim.
However, extending the timeline further back to the index's origins in the 1920s (when it tracked just 90 stocks) tells a more sober story. Data from 1928 to 2025 shows a lower average annualized return, ranging from 8.55% to 9.96%. The inclusion of the Great Depression's devastating market crash acts as a powerful anchor, pulling the long-term average down and serving as a reminder of the market's capacity for catastrophic loss.
Conversely, focusing on more recent, shorter timeframes can create an overly optimistic view. The 10-year period from 2014 to 2024 produced an average annualized return of 11.3%, while the 5-year period from 2019 to 2024 yielded an even more impressive 13.6%. Yet, the 20-year average, which crucially includes the fallout from the dot-com bubble and the 2008 crisis, is a much lower 8.4%.
This variability exposes a critical cognitive bias: recency bias. Investors who began their journey in the last 10 to 15 years have experienced an unusually strong and U.S.-centric bull market, conditioning them to see double-digit returns as the norm. Their perception of "normal" is skewed high compared to the full sweep of market history. This creates a psychological trap, setting the stage for disappointment and potentially poor decision-making when returns inevitably revert toward their long-term, and lower, mean. The 20-year average of 8.4%, which encapsulates two major bear markets, is arguably a more prudent and realistic benchmark for setting future expectations than the more exciting 10-year figure.
The Inflation Heist: Nominal Grandeur vs. Real-World Gains
The most significant sleight of hand in the 10% story is the quiet omission of inflation. The headline return figure is a nominal return, representing the growth of an investment in dollar terms. However, it fails to account for the erosion of purchasing power caused by rising prices. The real return, which is the nominal return minus the rate of inflation, is the only metric that measures a true increase in wealth.
When viewed through this lens, the market's performance appears far more modest. The impressive ~10.3% nominal return since 1957 shrinks to a more earthly ~6.5% after adjusting for the historical average inflation rate. Similarly, the ~9.96% nominal return since 1928 deflates to a real return of ~6.69%. This is a substantial difference; over decades of compounding, it represents a monumental gap in actual wealth accumulation.
The ultimate goal of investing is not to accumulate the most dollars, but to increase one's ability to purchase goods and services in the future. Focusing on the nominal figure is a vanity metric that can lead to a false sense of security. A 10% nominal return achieved during a period of 8% inflation, as was common in the 1970s, represents a meager 2% real gain. In contrast, a 7% nominal return during a period of 2% inflation, a more recent scenario, represents a much healthier 5% real gain. Framing investment goals in real, inflation-adjusted terms is a crucial discipline for any serious long-term investor. It shifts the focus from chasing headline numbers to building durable, real-world purchasing power.
The Anatomy of a Return: Price vs. Payouts
An equity's total return is derived from two distinct sources: the change in its price (capital appreciation) and the dividends it pays out to shareholders. Understanding the shifting balance between these two components is critical to understanding the character of the market and its future potential.
Over the very long term, dividends have been an unsung hero of market returns. Since 1926, dividend income and its reinvestment have contributed approximately 31% of the S&P 500's total return, with capital appreciation making up the other 69%. This contribution, however, has been anything but stable. During the high-inflation, low-growth decade of the 1970s, dividends were the star of the show, accounting for a staggering 70% of total returns. In stark contrast, during the technology-fueled bull market of the 1990s, their contribution shrank to a mere 15%.
More recently, the market has witnessed a secular, or long-term, decline in the importance of dividends. The average dividend yield for the S&P 500, which was a healthy 4.21% between 1970 and 1990, fell to just 1.98% for the period between 2009 and 2019. Today, the yield hovers well below 2%, a level that is historically abnormal.
This is not a temporary market fluctuation; it reflects a fundamental change in the "corporate contract." In prior eras, a mature, profitable company was expected to return a significant portion of its earnings to shareholders as cash dividends. Today, corporate capital allocation strategies, especially within the dominant technology and growth sectors, have shifted dramatically. Cash is now preferentially deployed toward internal research and development, strategic acquisitions, and, most notably, share buybacks, which boost earnings per share without a direct cash payout to investors.
This structural shift has profound implications for the future. It means that total returns are now far more dependent on capital appreciation than they were in the past. This, in turn, makes the market's performance more reliant on the two drivers of capital gains: corporate earnings growth and changes in the market's valuation multiple (the P/E ratio). Because both of these drivers are inherently more volatile and less certain than a steady stream of dividend payments, the overall risk profile of the market has increased. It has become more sensitive to economic growth expectations and the level of interest rates, which directly influence valuation multiples. The reliable, income-generating ballast that dividends once provided has been significantly reduced.

The Main Event - The S&P 500's Wild Ride
To speak of an "average" return is to smooth over a history that is anything but smooth. The lived experience of an investor is not one of steady, predictable gains. It is a journey of exhilarating peaks and terrifying troughs. Understanding the sheer volatility and cyclical nature of the market is paramount to developing the psychological fortitude required for long-term success.
The Illusion of the Average: A Lumpy, Bumpy Reality
The 10% average is a statistical artifact, a mathematical center of gravity around which annual returns violently swing. It is a destination that the market rarely, if ever, visits in a single year. An analysis of nearly a century of data reveals that the S&P 500's annual total return fell within a tight band of 8% to 12% in fewer than ten individual years. The reality is one of extremes.
The historical record is littered with years of breathtaking gains and crushing losses. Since its modern inception, the S&P 500 has posted annual total returns as high as +53.1% and as low as -37.0%. Looking at price returns since 1928, the range is even wider, from a gain of +46.6% in 1933 to a loss of -47.1% in 1931. This is not a gentle stream; it is a raging river with placid pools and violent rapids.
This extreme volatility is not a design flaw of the market; it is its essential feature. It is the very reason that equities have, over the long run, delivered a premium return compared to safer assets like government bonds. If returns were a guaranteed 10% every year, there would be no risk involved, and consequently, no reward for bearing it. The "equity risk premium" is the compensation investors demand for enduring these wild swings. The price of admission for capturing the long-term average is the willingness to remain invested through the inevitable downturns without panicking. History provides a powerful lesson in this regard: every major decline in the S&P 500 has been followed by an eventual recovery and a new all-time high, though the time it takes to recover has varied significantly. This reframes volatility from a pure negative to be avoided into a necessary, albeit uncomfortable, characteristic of the engine of long-term wealth creation.
Distribution of S&P 500 Annual Total Returns (1928-2024)
The following table illustrates the frequency distribution of the S&P 500's annual total returns, underscoring the wide dispersion and the rarity of an "average" year.

A Tale of Two Markets: Bull Roars and Bear Bites
The market's history is a story of cycles, of long secular bull markets characterized by sustained growth, punctuated by shorter, sharper bear markets. Examining these distinct periods reveals how the market's character evolves over time.
The bull markets are the stuff of legend. The post-World War II boom of the 1950s was fueled by industrial might and a growing middle class. The 1990s were driven by the dawn of the internet age and a surge in technology stocks, a period that saw multiple years of greater than 20% returns. More recently, the recovery from the 2008 Global Financial Crisis (GFC) was a powerful bull run, with the S&P 500 delivering a +26.46% return in 2009 and a stunning +32.39% in 2013 as monetary policy provided a massive tailwind.
The bear markets, though painful, are equally instructive. The dot-com bust from 2000 to 2002 was a brutal unwinding of speculative excess, delivering three consecutive years of negative returns: -9.1%, -11.89%, and -22.1%. The GFC was a systemic crisis born of financial leverage, culminating in a devastating -37.0% return in 2008. The 2022 downturn, driven by the fastest inflation spike in 40 years and the subsequent sharp rise in interest rates, saw the market fall -18.11%.
What this history demonstrates is that the drivers of market cycles change. The S&P 500 of 1957, where the Industrials sector represented over 40% of the index, is a fundamentally different entity from the S&P 500 of the 2020s, where the Information Technology sector now exceeds 25% of the market capitalization. The forces that ended the stagflation of the 1970s (a collapse in energy prices and aggressive monetary tightening) were different from those that burst the 2000 tech bubble (irrational valuations) or caused the 2008 crisis (subprime mortgage contagion). Therefore, while past cycles provide an invaluable guide to the market's potential behavior, they are not a perfect map for the future. A deep understanding of the current market's structure—its sector composition, its valuation, its key dependencies—is essential for accurately assessing the risks and opportunities that lie ahead.
The Market's Magic Quadrant - A Comparative Analysis of Equity "Vendors"
No investment decision is made in a vacuum. To truly understand the S&P 500's performance and prospects, it must be benchmarked against its peers. By adapting Gartner's renowned Magic Quadrant framework, we can categorize major equity markets as "vendors" competing for a strategic role in an investor's portfolio. This provides a powerful visual tool for comparative analysis, moving beyond a simple focus on a single index.
Choosing Your Champion
In this framework, we assess each equity "vendor" along two critical dimensions:
Y-Axis: Ability to Execute (Historical Risk-Adjusted Performance): This axis measures how well an asset class has historically delivered returns for the amount of risk taken. It is a composite score based on long-term compound annual growth rate (CAGR) and standard deviation (a measure of volatility), effectively representing the Sharpe Ratio. A higher position on this axis indicates a more efficient and proven track record of generating returns.
X-Axis: Completeness of Vision (Forward-Looking Potential): This axis assesses the future prospects of an asset class. It is a composite score based on current valuation metrics (like P/E and price-to-book ratios), consensus analyst forecasts for earnings growth, and exposure to long-term secular growth themes such as technology, demographics, and shifting global trade patterns. A position further to the right indicates a more compelling story and stronger potential for future outperformance.
Quadrant Placement & Analysis
Plotting the major global equity indices on this quadrant reveals a clear and insightful strategic landscape.
Leaders (High Ability to Execute, High Completeness of Vision)
U.S. Large-Cap (S&P 500): The S&P 500 sits firmly in the Leaders quadrant. Its "Ability to Execute" is unmatched, with decades of superior risk-adjusted returns compared to most global peers. Its "Completeness of Vision" is also strong, anchored by its heavy exposure to the world's most dominant technology and growth companies. However, its position is not unassailable. Its vision is clouded by significant headwinds, including historically high valuations that limit future upside and a dangerous level of concentration risk in a few mega-cap names. It is the reigning champion, but its crown is heavy, and its future dominance is being actively questioned by the market.
Challengers (High Ability to Execute, Lower Completeness of Vision)
U.S. Small-Cap (Russell 2000): Over the full sweep of history, U.S. small-cap stocks have demonstrated a powerful "Ability to Execute," often outperforming large-caps and delivering a significant "size premium". This places them high on the vertical axis. However, their "Completeness of Vision" is currently viewed as more challenged. The past decade has seen a notable period of underperformance relative to large-caps. Furthermore, small-cap companies are inherently more sensitive to the domestic economy and rising interest rates, as they are often less profitable and more reliant on credit. This makes their forward-looking path more uncertain in the current macroeconomic environment.
Visionaries (Lower Ability to Execute, High Completeness of Vision)
International Developed (MSCI World/EAFE) & Emerging Markets (MSCI EM): These markets are the quintessential Visionaries. Their historical "Ability to Execute" has been lackluster compared to the U.S., with significantly lower returns over the past 10 and 20 years. This places them lower on the vertical axis. However, their "Completeness of Vision" is arguably the most compelling in the current environment. This vision is built on a foundation of much more attractive starting valuations, higher dividend yields, and the potential to benefit from a weaker U.S. dollar and the "friendshoring" of global supply chains. They are the up-and-coming contenders with a powerful story about mean reversion and relative value.
Niche Players (Lower Ability to Execute, Lower Completeness of Vision)
United Kingdom (FTSE 100): The FTSE 100 occupies the Niche Player quadrant. Its historical "Ability to Execute" has been modest, with long-term returns lagging well behind the S&P 500. Its "Completeness of Vision" is also limited. While it offers a high dividend yield and some defensive qualities, its sector composition—heavily weighted towards "old economy" industries like financials, energy, and materials—offers less exposure to the high-growth themes driving the global economy. Its prospects are also closely tied to the UK's domestic economic challenges.
This quadrant analysis reveals a critical dynamic: the cycle of leadership. The current placement of U.S. Large-Cap as the undisputed Leader is the result of a decade-long cycle of outperformance. History teaches that such periods of dominance are not permanent. The very factors that relegate International and Emerging Markets to the Visionary quadrant today—namely, lower valuations and investor neglect—are often the precise ingredients for their future outperformance. Conversely, the factors that cement the S&P 500's Leader status—high valuations, high investor enthusiasm, and heavy concentration—are frequently the precursors to a period of mean reversion and underperformance. The Magic Quadrant, therefore, serves not just as a snapshot of the present but as a strategic warning against the dangerous practice of simply extrapolating the past into the future.
Global Equity Index Performance & Characteristics

Crystal Ball Analytics - Forecasting the Next Decade
While past performance is an imperfect guide, a disciplined analysis of current conditions can provide a reasonable framework for forecasting future returns. By combining insights from leading financial institutions with a fundamental model of return drivers, we can move beyond simple extrapolation and build a data-backed outlook for the next ten years.
The Building Blocks of Future Returns
At its core, the long-term total return from an equity investment can be deconstructed into three fundamental components. This simple but powerful model provides a clear lens through which to evaluate any forecast:
FutureTotalReturn≈CurrentDividendYield+AnnualizedEarningsGrowth±ChangeinValuationMultiple
This equation grounds forecasting in reality. It forces an analyst to move beyond simple trend-following and make explicit assumptions about the three levers that will generate returns: the income paid out to shareholders (yield), the growth of the underlying business profits (earnings), and the price investors are willing to pay for those profits (valuation).
The Analyst Roundtable: A Synthesis of Forecasts
When we survey the landscape of 10-year forward-looking return forecasts from major investment houses, a remarkably consistent theme emerges: a future of moderated returns, especially for U.S. large-cap stocks.
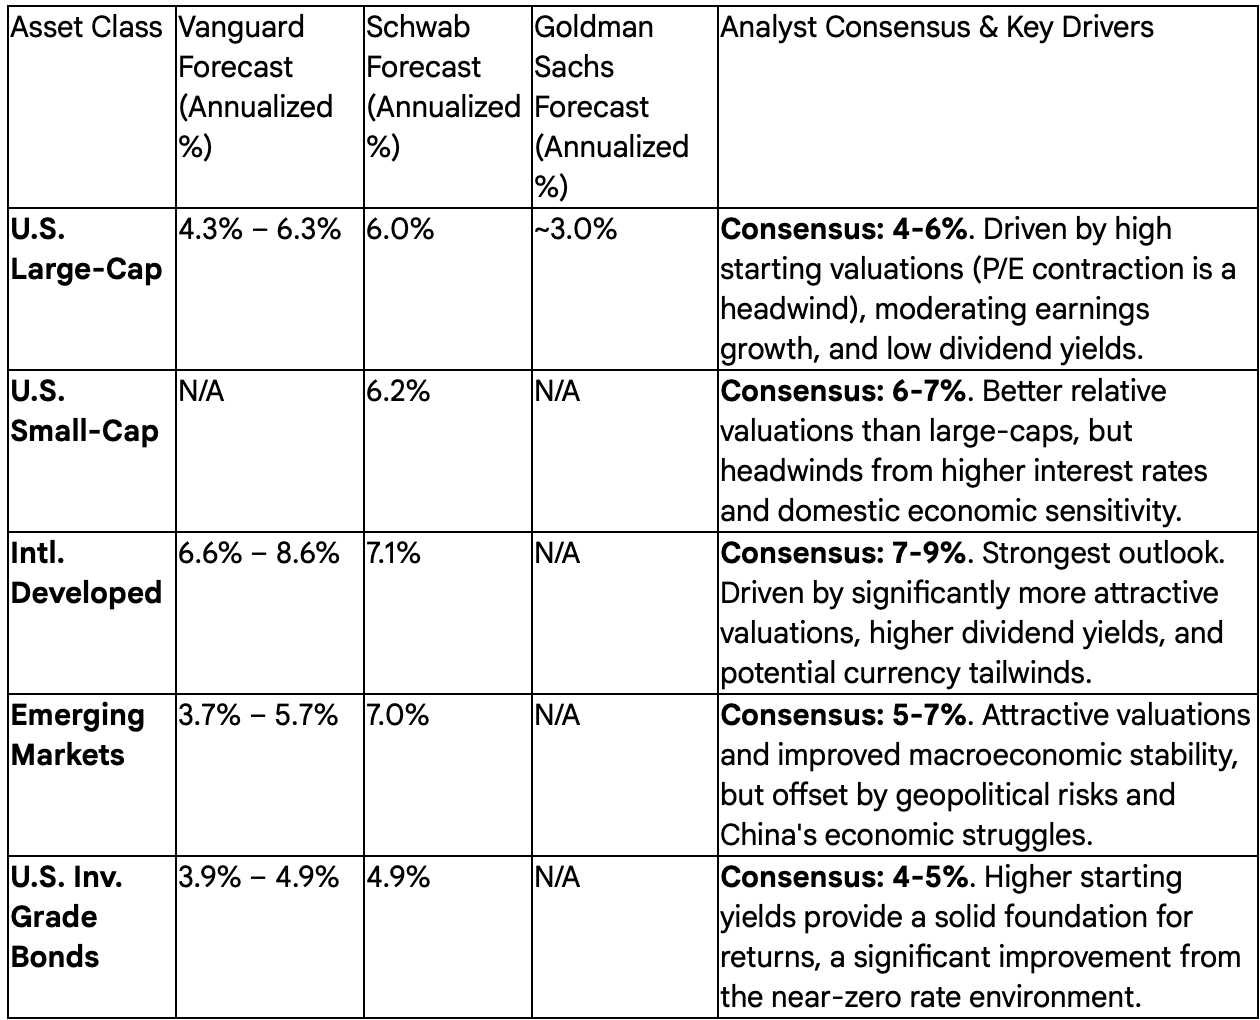
Goldman Sachs: While their short-term forecast for 2025 anticipates a potential 10% total return, their more rigorous long-term model paints a starkly different picture. Citing high starting valuations as a major drag, their model forecasts a sobering 3% annualized nominal total return for the S&P 500 through 2034.
Charles Schwab: Schwab's capital market expectations echo this sentiment, forecasting an average annual return of just 6.0% for U.S. large-caps over the next decade. This is less than half the 13.0% return delivered in the prior decade. They point directly to the building blocks: sky-high valuations, moderating GDP growth that will cap earnings, and a diminished contribution from dividends.
Vanguard: Vanguard's proprietary Capital Markets Model projects a 10-year annualized return range for U.S. equities of 4.3% to 6.3%. Notably, their model sees more promising returns overseas, forecasting a 6.6% to 8.6% range for developed international markets, driven almost entirely by more attractive starting valuations.
The consensus is clear and compelling. The major institutional players, using different proprietary models, are all arriving at a similar conclusion: the party of the 2010s is over, and the next decade will be a more challenging environment for generating equity returns.
Under the Hood: Key Assumptions
These muted forecasts are not born of simple pessimism, but are the logical output of a set of sober assumptions about the key drivers of return.
Assumption 1: A New Interest Rate Regime. The era of zero-percent interest rates is definitively over. The consensus forecast sees inflation moderating toward the Federal Reserve's 2% target but remaining a persistent concern, forcing the Fed to keep rates "higher for longer." While a couple of rate cuts may occur in 2025, econometric models project a new long-term neutral Fed Funds Rate in the 3.50% to 3.75% range. This has a direct and powerful effect on the valuation component of the return equation. Higher risk-free rates create a higher "gravity" for all asset valuations, putting a firm ceiling on how high P/E multiples can sustainably go.
Assumption 2: Normalizing Corporate Earnings Growth. The torrid pace of earnings growth seen in the post-GFC recovery is unlikely to be sustained. While analysts still see healthy growth for 2025 (FactSet consensus at 9.0-9.5%, Goldman at 11%), these numbers are already being revised downwards, and the outlook for 2026 and beyond is more modest. Longer-term models, like Schwab's, project real per-share profit growth of just 2.4% annually, reflecting a combination of moderating economic growth and potential pressure on historically high profit margins. With less room for P/E multiple expansion, this more modest earnings growth becomes the primary engine of future returns.
Assumption 3: Valuation as a Headwind, Not a Tailwind. This is the most critical assumption. The S&P 500's current forward P/E ratio of approximately 21.6x is significantly above its 5-year average of ~19.9x and its 10-year average of ~18.4x. Other long-term valuation measures, such as the Cyclically Adjusted Price-to-Earnings (CAPE) ratio developed by Robert Shiller, are also at levels that have historically preceded periods of low or even negative long-term returns. From these elevated levels, it is statistically far more probable that valuation multiples will contract over the next decade than expand further. A contraction in the P/E ratio acts as a direct mathematical drag on total returns, potentially offsetting a significant portion of the gains from earnings growth and dividends.
The confluence of these forecasts points to a major paradigm shift. The last decade was largely defined by the tailwind of falling interest rates and quantitative easing, which lifted the valuations of nearly all asset classes in what some have called the "Everything Bubble." That era is over. The forecasts from Goldman Sachs, Schwab, and Vanguard all signal a transition away from a valuation-driven market to an earnings-driven market. Future returns will have to be ground out the old-fashioned way—through real corporate profit growth and cash dividends—not simply by riding a wave of ever-expanding multiples fueled by cheap money. This new reality demands a more discerning, fundamentals-focused, and globally diversified approach from investors.
Synthesized 10-Year Forward Return Forecasts
The Elephant(s) in the Room - Key Risks & Disruptors
The path to the moderated returns of the next decade is not guaranteed to be a smooth one. Several significant risks and structural changes are reshaping the investment landscape. These "elephants in the room" have the potential to disrupt markets, challenge long-held assumptions, and create both peril and opportunity for investors.
Concentration Risk: The Magnificent Seven's Double-Edged Sword
The S&P 500 is no longer your grandfather's index. While it still comprises 500 of America's leading companies, its performance has become overwhelmingly dominated by a small handful of mega-cap technology and growth stocks. This concentration presents a profound, and often misunderstood, risk.
The data is stark. In 2024, a single company, NVIDIA, accounted for nearly a quarter of the S&P 500's entire growth in market capitalization. A broader look at the so-called "Great 8" stocks (Apple, Amazon, Google, Meta, Microsoft, Netflix, NVIDIA, Tesla) reveals a market within a market. In the first quarter of 2025, this elite group posted year-over-year earnings per share (EPS) growth of 28.9% and traded at a lofty average price-to-earnings (P/E) ratio of 30.0x. The other 492 companies in the index, by contrast, saw EPS growth of just 8.9% and traded at a more modest 20.2x P/E.
The implication is that an investment in a "diversified" S&P 500 index fund is now, in practice, a heavily concentrated and leveraged bet on the continued success of U.S. mega-cap technology. This creates a structural fragility that did not exist to this degree in prior market cycles. If these few titans were to falter due to increased competition, regulatory action, or a simple deceleration in their hyper-growth, they would inevitably drag the entire index down with them, regardless of the solid performance of the hundreds of other constituent firms. The diversification benefit that is the primary rationale for index investing has been significantly eroded.
Geopolitical Risk: A Fragmented World
The post-Cold War era of accelerating globalization, which provided a powerful tailwind for corporate profitability, is giving way to a new era of great power competition and geopolitical fragmentation. This shift represents a significant structural risk to global markets.
The landscape is defined by rising U.S.-China competition, active military conflicts, and a turn towards protectionist policies like tariffs. This is forcing a costly re-engineering of global supply chains, as companies move from "just-in-time" to "just-in-case" inventory management and shift production to more geopolitically aligned nations ("friendshoring"). These trends directly threaten the profit margins of the large multinational corporations that have benefited most from globalization and that now dominate the S&P 500. The new environment introduces higher input costs, greater operational uncertainty, and the constant threat of sudden market shocks from diplomatic flare-ups or trade disputes.
Regulatory Headwinds: The Watchdogs are Waking Up
After a long period of relatively laissez-faire policy, the regulatory environment is becoming more challenging. There is a growing focus from regulators across multiple fronts, creating a web of compliance costs and business model risks.
Key areas of scrutiny include the governance of artificial intelligence, the enforcement of fiduciary standards for investment advisors (such as Regulation Best Interest), and the persistent threat of antitrust action against big tech companies. Furthermore, the potential for significant changes in corporate and capital gains tax policy under a new administration adds another layer of profound uncertainty. For the market's largest sectors—Technology and Financials—new regulations can directly increase the cost of doing business, limit profitable activities, and compress margins. This uncertainty makes long-term capital planning more difficult for corporations and can weigh on investor sentiment.
The AI Revolution: The Ultimate Disruptor
Artificial intelligence stands apart as a uniquely powerful force, acting as both a massive opportunity and a profound risk. It is a meta-trend that will likely amplify both gains and losses across the market.
On the opportunity side, AI is a generational productivity driver. Its adoption has the potential to enhance corporate efficiency, unlock new revenue streams, and provide a significant boost to earnings for companies that successfully integrate it into their operations. The AI infrastructure market alone is projected to grow at a compound annual rate of 30.4% through 2030, representing one of the most significant growth stories in the global economy.
On the risk side, AI is a powerful disruptive force that will create a stark divide between winners and losers. Companies that fail to adapt their business models to the AI era risk being rendered obsolete. For investors, there is the additional risk that the market is already over-extrapolating the short-term benefits of AI, leading to bubble-like valuations in AI-related stocks that are disconnected from fundamental reality. Studies have also shown that while AI can augment human analysis, there is no evidence to date that purely AI-powered investment funds can consistently outperform the market on a risk-adjusted basis.
AI is not just another technology cycle; it is an amplifier of existing market dynamics. For the current market leaders, it could further entrench their dominance. For laggards, it will likely accelerate their decline. For the market as a whole, the proliferation of AI-driven algorithmic trading could increase the velocity and magnitude of market swings, leading to more frequent "flash crashes" and periods of heightened volatility. This will create a wider dispersion between winning and losing stocks, potentially making passive index investing a less effective strategy than it has been in the past and placing a greater premium on skillful active management and discerning stock selection.
Strategic Imperatives - Navigating the Post-10% World
The evidence is clear: the market environment that produced the easy, double-digit returns of the last decade is behind us. The journey ahead will require a more sophisticated and disciplined approach. Navigating this new landscape successfully is not about finding a new magic number to replace the 10% myth, but about embracing a set of core strategic principles grounded in the realities of a more challenging market.
Recalibrate Expectations
The first and most crucial step is a mental one: investors must acknowledge that the high-flying returns of the recent past are not the "new normal." The powerful tailwinds of falling interest rates and expanding valuation multiples have subsided and may even become headwinds. Financial plans, retirement goals, and return expectations should be anchored to the more realistic, mid-single-digit nominal returns and low-single-digit real returns that are projected by a consensus of institutional forecasters. Accepting this new reality is the foundation upon which all other sound strategic decisions are built.
Diversify, Diversify, Diversify (For Real This Time)
Diversification is the only free lunch in investing, yet many investors who believe they are diversified are, in fact, heavily concentrated in a single asset class: U.S. large-cap growth. True diversification in the coming decade will require a more deliberate and global approach.
Beyond U.S. Large-Cap: Given the extreme concentration risk in the S&P 500 and the compelling relative valuations found abroad, a meaningful, strategic allocation to international developed and emerging markets is no longer a tactical tweak but a core necessity. The conditions that have historically preceded periods of international outperformance—namely, U.S. overvaluation and international undervaluation—are firmly in place.
Across Factors: The academic evidence supporting the long-term outperformance of small-cap and value stocks is robust, even if these factors have languished over the past decade. The current cycle of large-cap growth dominance is one of the longest on record and is historically anomalous. Prudent portfolio construction suggests that maintaining a disciplined exposure to the size and value factors is a sound strategy for capturing returns when these long-term cycles inevitably turn.
Focus on Quality and Fundamentals
In an environment where valuation expansion is no longer a reliable source of return, the market's focus must inevitably shift back to underlying business performance. The era of "a rising tide lifts all boats" is giving way to a stock-picker's market, where the ability to differentiate between companies will be paramount. This places a premium on identifying companies with durable competitive advantages, strong balance sheets capable of withstanding economic shocks, resilient profit margins, and a demonstrated ability to generate consistent, real earnings growth.
Embrace Volatility as Opportunity
This report has demonstrated that volatility is not an anomaly but a constant and necessary feature of equity markets. While unsettling, market downturns are not merely risks to be endured; they are opportunities to be seized. For the long-term investor, periods of market panic and pessimism are chances to acquire quality assets at more attractive prices. Implementing a disciplined strategy of periodic rebalancing or consistent dollar-cost averaging—investing a fixed amount at regular intervals regardless of market conditions—is a proven method for turning market volatility from an enemy into an ally.
Conclusion
The 10% average return is a useful historical signpost, but it is a poor navigational chart for the journey ahead. It is a relic of a different era, forged in a different market structure and powered by different economic forces. The market of the next decade will likely be more challenging, more fragmented, and less forgiving than the one that came before. Success will not be found in clinging to simplistic rules of thumb. It will be achieved through a global perspective that recognizes value beyond U.S. borders, a disciplined focus on fundamental quality over speculative narratives, and the psychological fortitude to look past the seductive but ultimately misleading simplicity of a single "average" number.