

S&P Global: A Deep Dive with Extra Flavor!
Let's embark on a thrilling expedition into the world of S&P Global, a titan in the realm of financial data and analytics. Prepare to be dazzled as we uncover its impressive money-making prowess.

Podcast version for premium subscribers available here and on your podcast apps
Business Overview and Model: The Money-Making Machine
S&P Global isn't your average financial data company; it's a global powerhouse that plays a critical role in the smooth functioning of the financial markets. Think of them as the "essential workers" of the investing world, providing the intel and insights that keep the gears turning. They're like the Beyoncé of financial data – irreplaceable!
But how do they rake in the dough?
Let's break down how S&P Global generates its revenue, including its diverse product offerings, pricing models, and recurring income streams.
S&P Global's revenue streams are as diversified as its services. They can be categorized as follows:
Subscription Revenue: This is their bread and butter, the steady flow of cash that comes from subscriptions to their data, analytics, and research platforms. Think of it as their all-access pass to the financial world, with juicy tidbits on everything from market trends to company financials. In 2022, this VIP pass brought in a whopping 55% of their total revenue! Some of their hottest subscription products include their Market Intelligence desktop platform (think Bloomberg terminal, but with extra sprinkles), RatingsXpress, RatingsDirect, and those oh-so-handy data feed products.
Products: S&P Capital IQ Pro, RatingsDirect, Market Intelligence desktop products, data feeds, etc.
Pricing: Typically subscription-based, with annual or multi-year contracts. Prices vary based on the product, scope of access, and customer needs.
Recurrence: High recurrence due to the nature of subscription contracts. Customers often renew their subscriptions for continued access to essential data and tools.
Transaction Revenue: This is where things get exciting! S&P Global Ratings is a big name in the credit rating game, and every time a company, government, or financial institution issues debt, they need a credit rating. That's where S&P Global swoops in, providing those crucial ratings that tell investors how risky (or safe) that debt is. This revenue stream can be a bit of a wild ride, as it's tied to the ups and downs of the debt markets. But hey, who doesn't love a bit of volatility?
Products: Credit ratings for various debt instruments (corporate bonds, government bonds, structured finance, etc.).
Pricing: Typically based on the complexity and size of the transaction. Fees are often charged upfront or upon completion of the rating process.
Recurrence: Lower recurrence compared to subscriptions, as it depends on the frequency of transactions in the market.
Non-Transaction Revenue: This is the more "chill" side of the credit rating business. It includes those essential services like credit rating surveillance (making sure those ratings stay up-to-date), annual customer relationship fees (because keeping clients happy is key!), and entity credit ratings (giving the whole company a financial health check).
Products: Credit rating surveillance, entity credit ratings, customer relationship programs.
Pricing: Surveillance fees are often recurring annual payments. Entity credit ratings and relationship program fees can be one-time or recurring, depending on the service.
Recurrence: Moderate recurrence, with some services like surveillance providing recurring income.
Asset-Linked Fees: This revenue stream is all about those sweet, sweet ETFs and mutual funds. You see, S&P Dow Jones Indices creates and maintains those benchmarks that many funds track. And when investors pour their money into those funds, S&P Global gets a little taste of the action. In 2022, this accounted for a cool 8% of their total revenue. Not too shabby!
Products: Licensing of indices for ETFs, mutual funds, and other investment products.
Pricing: Typically a small percentage of the assets under management in the fund tracking the index.
Recurrence: Recurring revenue as long as the fund continues to track the index and attract assets.
Sales Usage-Based Royalties: This is where S&P Global's data and indices become the stars of the show. They license out their proprietary information to other financial players, like exchanges and investment firms, who use it to create their own fancy products. It's like S&P Global is the hitmaker, and everyone else is clamoring for their tunes! This revenue stream might be smaller (3% in 2022), but it's a testament to the value of S&P Global's data and expertise.
Products: Licensing of data and indices for use in financial products, exchanges, and trading platforms.
Pricing: Royalties are typically based on usage or trading volume linked to the licensed data or index.
Recurrence: Recurring revenue stream, but can fluctuate with market activity and usage of the licensed products.
This diversified revenue model provides S&P Global with financial stability and resilience, allowing them to weather market fluctuations and invest in future growth.
Clients and Global Domination: From Wall Street to the World
Who are the lucky clients who get to work with S&P Global? Well, it's a who's who of the financial world:
Investment banks (think Wall Street hotshots)
Commercial banks (your friendly neighborhood bank, but on a much larger scale)
Insurance companies (those who protect you from life's unexpected curveballs)
Trading firms (the speed demons of the financial markets)
Asset managers (the ones who make your money work for you)
Corporations (from small businesses to Fortune 500 giants)
Governments (yes, even Uncle Sam needs a bit of financial guidance)
And where does S&P Global ply its trade? Pretty much everywhere! They're like the financial version of the Avengers, with a global reach that spans continents. Here's the breakdown of where those 2023 revenues came from:
United States: 60% (the home turf!)
European Region: 23% (ooh la la!)
Asia: 11% (the rising star)
Rest of the World: 6% (the up-and-comers)
Market Landscape and Growth Prospects: The Future is Bright (and Data-Driven)
S&P Global might be a big fish, but it's not swimming alone. The financial data and analytics pond is full of other players, like Moody's, Fitch (the other big credit rating agencies), MSCI (the index king), and the London Stock Exchange Group (a global financial infrastructure giant). It's a competitive market, with everyone vying for a piece of the action. But S&P Global has a few secret weapons up its sleeve:
Global economic growth: As long as economies keep chugging along, the demand for financial services will keep growing, and that means more business for S&P Global. It's like a rising tide that lifts all boats (especially those carrying valuable financial data!).
Market volatility: When the market gets jittery, investors get hungry for information. They want to know what's going on, where the opportunities are, and how to protect their hard-earned cash. That's where S&P Global comes in, providing the insights and analysis that investors crave. It's like being the only ice cream shop in a heatwave!
Innovation: S&P Global isn't just sitting back and counting its money; it's constantly innovating and developing new products and services to meet the evolving needs of its clients. From ESG products that help investors make sustainable choices to GenAI capabilities that analyze data faster than you can say "algorithm," S&P Global is always one step ahead. It's like having a crystal ball that shows you the future of finance!
What’s the difference between S&P Global and Blackrock in the index sector?
While both S&P Global and Blackrock are big names in the index game, they have different approaches and offerings.
S&P Global
SPGI is like the master chef of the index world, whipping up those benchmark indices that everyone loves to track. Think of them as the creators of the "original recipe," those classic indices like the S&P 500 that are the foundation of many ETFs and mutual funds.
But SPGI isn't a one-trick pony. They offer a whole menu of indices, from equity and fixed income to commodities and real estate, covering all corners of the market. And if that's not enough, they also whip up custom indices and offer data subscription services. Talk about a full-service index restaurant!
So, how do they get paid for all this culinary creativity? Well, they have a few tricks up their sleeve:
Asset-linked fees: When investors pour their money into a Blackrock ETF tracking SPGI's indices, SPGI gets a small cut of the action. It's like getting royalties every time someone uses their recipe!
Sales usage-based royalties: SPGI also licenses out its data and indices to other financial players, who use them to create their own products. It's like selling the secret ingredient to other chefs!
Data subscription fees: And of course, they offer those data subscription services, providing clients with the raw ingredients they need to cook up their own investment strategies.
SPGI is a big deal in the benchmark index space, especially when it comes to ETFs. They're constantly innovating and launching new indices and product features, keeping their menu fresh and exciting.
Blackrock
Now, Blackrock is like the fast-food chain of the index world. They're not as focused on creating those original recipes; instead, they take existing indices (including many from SPGI) and package them into those convenient, ready-to-consume ETFs called iShares.
Blackrock's iShares ETFs are like the Big Macs of the investing world – popular, widely available, and covering a huge range of tastes. They've got ETFs for every asset class, investment strategy, and geography you can think of.
And how does Blackrock make its money? Primarily through those expense ratios, the small fees they charge investors to manage their iShares ETFs. It's like charging for the convenience of having your meal prepared and served to you.
Blackrock is the undisputed king of the ETF jungle, with iShares holding a massive market share. They're constantly expanding their menu, adding new ETF products and investment strategies to satisfy those investor cravings.
What you should keep in mind is that SPGI is the index chef, creating and maintaining those benchmark indices. Blackrock is the ETF chef, taking those indices and packaging them into iShares.
Valuation: Is This Stock a Diamond or a Dud?
Now, for the moment of truth: is S&P Global worth its weight in gold (or at least its current stock price of $500)? With a free cash flow per share of $16.5, we get a price-to-free-cash-flow (P/FCF) ratio of 30.3 and a free cash flow yield of 3.3%. Hmm, that's a bit higher than those safe-and-sound treasury bonds yielding 4.4%. And remember, stocks are riskier than bonds, so we expect a higher return to compensate for that extra risk.
Investment Decision: To Buy or Not to Buy, That is the Question!
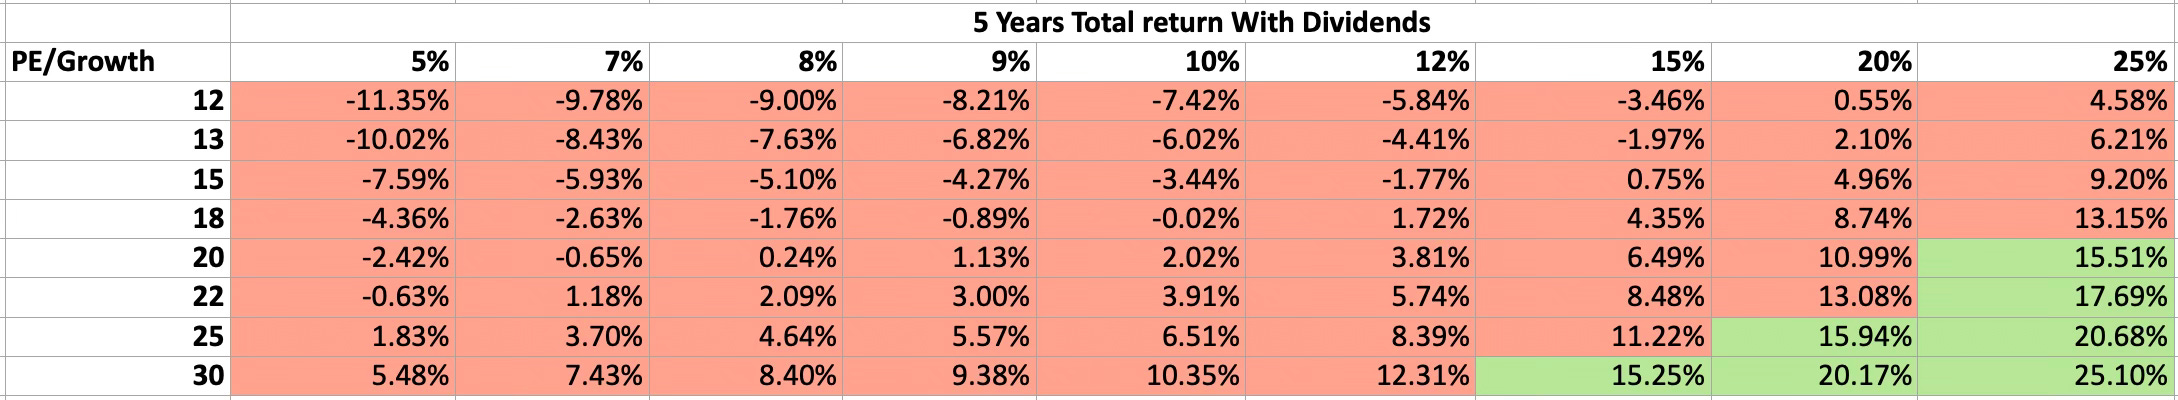
S&P Global is a fantastic company, no doubt about it. It's got a strong market position, a diversified business model, and a bright future ahead. But here's the thing: even if it grows at a solid 15% per year for the next five years (and that's including those handy-dandy buybacks that boost earnings per share), that P/FCF of 30.3 is giving me a bit of heartburn. It's just too pricey for my taste!
So, should you buy S&P Global stock right now? In my humble opinion, no. It's a fantastic company, but it's simply overvalued at the moment. However, don't write it off entirely! Keep it on the watchlist, and if the price comes down to a more reasonable level, then it might be time to pounce. Remember, patience is a virtue, especially in the investing game!
Loved this? Then share it, for the love of all that is holy! My family is threatening to eat me if I don't bring home the bacon (or the clicks)!
We've got fresh articles dropping every Tuesday and Thursday! Tuesdays are your day for a FREE dose of market magic, covering everything from the hottest trends to personal finance tips (we'll even throw in the occasional meme, just for kicks). But hold onto your hats, because Thursdays are for our subscribers ONLY! That's when we unleash the DEEP DIVE – earnings calls, hot-off-the-press reports, and all the juicy market happenings you need to know, served up with a side of serious analysis. So, grab your free Tuesday treat, and then consider joining the club for the Thursday feast!
Disclaimer: The information provided in our analyses and reports is for informational and educational purposes only and should not be considered investment advice. We are not financial advisors, and nothing we say or write should be construed as a recommendation to buy or sell any security.
While we strive to provide accurate and insightful information, we make no representations or warranties of any kind, express or implied, about the completeness, accuracy, reliability, suitability, or availability with respect to the information presented.
It is important to note that we may or may not hold positions in the companies we discuss. Any opinions expressed are our own and are subject to change without notice.
Always conduct your own thorough research and consult with a qualified financial advisor before making any investment decisions. Never invest more than you can afford to lose.